

Volume 5, Issue 4 (10-2021)
EBHPME 2021, 5(4): 222-233 |
Back to browse issues page


Download citation:
BibTeX | RIS | EndNote | Medlars | ProCite | Reference Manager | RefWorks
Send citation to:


BibTeX | RIS | EndNote | Medlars | ProCite | Reference Manager | RefWorks
Send citation to:
Dehnavi H, Rezaee M, Khosravi M F, Gharasi Manshadi M, Saeidpour J. Evaluation of Inpatient Surgical Wards’ Performance at the Hospitals Affiliated with Tehran University of Medical Sciences in 2018. EBHPME 2021; 5 (4) :222-233
URL: http://jebhpme.ssu.ac.ir/article-1-338-en.html
URL: http://jebhpme.ssu.ac.ir/article-1-338-en.html
Hamed Dehnavi 

 , Mehdi Rezaee , Mohammad Farough Khosravi , Mahdi Gharasi Manshadi , Jalal Saeidpour *
, Mehdi Rezaee , Mohammad Farough Khosravi , Mahdi Gharasi Manshadi , Jalal Saeidpour *
Health Information Management Research Center, Tehran University of Medical Sciences, Tehran, Iran , jsaeidpour@tums.ac.ir
Full-Text [PDF 2728 kb]
(849 Downloads)
| Abstract (HTML) (2088 Views)
Full-Text: (453 Views)
Background: Surgery wards account for a significant portion of hospital costs, followed by patient costs. Improving surgery wards' performance plays a major role in enhancing the accountability and efficiency of the hospital. This study aimed to evaluate the performance of inpatient surgical wards at the hospitals affiliated with Tehran University of Medical Sciences(TUMS).
Methods: A descriptive, cross-sectional, retrospective study was performed at all hospitals affiliated with TUMS in 2018. To measure the efficiency of these wards, three indicators have been considered; bed occupancy rate, the average length of stay, and bed turnover. Data have been analyzed using Excel software based on the Pabon Lasso model .
Results: Among the 15 active surgical departments, 5 (33.31 %) were categorized in quadrant three, including ophthalmology, obstetrics and gynecology, vascular and trauma surgery, plastic surgery, and infertility department. The oral and maxillofacial surgery and general surgery departments were the poorest in their performance and located in quadrant one. Ten surgical wards out of 38 (26.33 %) have reported a satisfactory performance.
Conclusion: Understanding and comparing the performance of clinical departments is also useful in making decisions for standardizing the patterns of health services delivery, evidence-based management in health care centers, and enhancing accountability in the health system. It is suggested that managers revise the departments in the inefficient area to reduce the number of inefficient departments or attract more patients by marketing, diversifying services, and increasing the quality of services.
Keywords: Performance, Evaluation, Efficiency, Surgical ward, Pabon Lasso
Introduction
As one of the largest economic sectors, the health system is deemed one of the most important pillars of sustainable development and social welfare (1). Despite scientific progress and new technologies, management of the health system encounters many challenges such as increasing population, expectations of the growing community, and aging (2). These challenges have led to increased demand and expenditures for health services, which have impacted the quality and quantity of the provided healthcare (3). To address such challenges, health systems mainly have to focus on health facilities and strengthening the infrastructure of healthcare organizations such as hospitals (4).
Hospitals are among the most complex and costly components of the health system. Consequently, the way they operate has a major effect on health system resources and outcomes (5-7). The World Health Organization has identified hospitals as the predominant provider of health care and one of the predetermining factors for equitable distribution of health care and promoting fairness indicators in the health system (8). A large portion of the health budget is allocated for hospitals, 80 % and 40 % in developing and developed countries, respectively (9). These budgets could be accounted for the number of specialized professionals, sophisticated equipment, and the variety of used pharmaceuticals. Although the demand for hospital services is growing,
the estimated efficiency of hospitals doesn't exceed 50 %, which sheds light on poor managerial practices (10).
Given the vulnerable structures in developing countries, the importance of this inefficiency becomes greater (11, 12); therefore, special attention should be paid by managers and policymakers to the performance of hospitals, especially in economic and social constraints (13).
Evaluating the hospitals' performance seems necessary in light of their complexity, high costs, specialized services, and the importance of productivity and effectiveness of services. The hospitals consist of various wards, and the surgical ward is one of the most important wards of hospitals. Patients in need of surgery are operated on in this ward. The surgical department is very expensive in terms of construction, equipment, workforce, and management. Surgery account for a significant portion of hospital costs, followed by patient costs. Improving work processes can improve the quality of surgical services and patient satisfaction, reduce unnecessary costs, improve performance, and increase operating income (14). Evaluation can be defined as a method of analyzing the current situation and accurately measuring the system's performance based on the organizational goals and allocated resources (15). The evaluation system should be able to measure the organization's performance and compare it with similar organizations (16). In addition, applying an appropriate model for hospital performance evaluation can lead to increasing accountability, satisfaction, and improving service quality (17).
Different models and methods can be used to evaluate hospitals' performance. The most common way to evaluate hospitals' performance is to measure their efficiency (18). Based on its definition of maximizing the use of resources, the level of efficiency should be determined by a set of indicators appropriate for benchmarking (19). Continuous monitoring of each hospital's performance and comparing them with other hospitals is a useful tool for rationalizing resource allocation, organizing input resources, and improving health outcomes (20). In 1986, Pabon Lasso presented a model in Colombia for determining the relative hospitals' performance using three indicators; Bed Occupancy Rate (BOR), Bed Turnover Rate (BTR), and the Average Length Of Stay (ALOS) (21).
So far, several studies have been carried out in Iran to evaluate hospitals' performance using the Pabon Lasso model (3, 5, 22-25). In a study conducted in Ardabil, the results have shown that 42/01 % of the hospitals were in quadrant one, 35.72 % in quadrant 3, and 21.41 % in quadrant four. The ALOS, BOR, and BTR were 2.44 days, 55.40 %, and 80.80 times per year, respectively (4). At Kurdistan University of Medical Sciences, another study has revealed that 42.01 % of medical centers affiliated with the university were efficient as they located in quadrant 3 (26). A survey of 23 hospitals in Urmia stated that only 35 % of these hospitals were efficient (22). In total, most of the previous studies have shown that the capacity of hospital beds in Iran is not well-utilized (27).
Each of these studies has provided a picture of hospitals' performance in a specific region of the country, but so far, no study has been conducted to evaluate the different wards of hospitals in Iran. As a result, this study was conducted to evaluate the performance of the wards of TUMS in 2018 to provide hospital managers with a clear picture of the performance of each ward and to use strategies to improve it.
Materials and Methods
This is a descriptive, cross-sectional, and retrospective study aimed to evaluate the efficiency of surgical wards hospitals affiliated with TUMS (14 hospitals) between 21 March and 22 September 2018 (the first half of the solar calendar 1397). All surgical wards including general surgery, ear, nose, and throat (ENT), obstetrics and gynecology, pediatric, oral and maxillofacial surgery, neurosurgery, urology, plastic surgery, vascular surgery, orthopedics, eye surgery, cancer surgery, cardiothoracic surgery, cardiac surgery, infertility were included.
To evaluate the performance of inpatient surgical wards, the Pablon Lasso model was used. This model is one of the most useful models that can simultaneously compare performance indicators. Three indicators, including BOR, ALOS, and BTR, are hospital wards' most important performance indicators (28). The bed occupancy rate is a measure for the utilization of the available beds in the hospital. The average length of stay indicates the status of patient stay management in the hospital. The bed turnover rate is the number of times patients have used a hospital bed over a period of time.
These three indicators are placed on the X, Y, and Z axes, respectively. Accordingly, the wards will be distributed into four quadrants; quadrant 1 in which the wards are inefficient as having low BOR and BTR, quadrant two including the relatively- efficient wards of low BOR but high BTR, quadrant three, which embraces the efficiency of high BOR and BTR, and quadrant 4 in which the wards are relatively efficient with high BOR but low BTR. The latter category of wards is relatively efficient as the patients are admitted for a long period of time.
Since using the Pabon Lasso model, the studies have only evaluated the performance at the hospitals level. Meanwhile, hospitals have multiple inpatient departments, including surgery, internal medical, and special departments; therefore, measuring the performance across all departments in total is a small contribution to hospital managers as it does not determine the problematic department(s) precisely. Hence, it is better to demonstrate the location of each ward on the Pabon Lasso diagram rather than the overall hospital as a whole. By doing so, managers can better identify the inefficient wards and then take them into consideration in any upcoming improvement plan.
For the first time, we used the Pabon Lasso model to evaluate the performance of all inpatient surgical wards at hospitals affiliated with TUMS. Using this method, we can analyze and compare the performance of inpatient wards at each hospital and compare them with each other. This approach helps managers to evaluate the performance of medical departments in utilizing the hospital beds. Moreover, this perspective helps in planning to enhance efficiency to maximize the benefits of scarce resources and promote evidence-based management.
Data were collected after obtaining the necessary permissions by referring to the statistics unit of the Vice-Chancellor for Treatment Affairs at TUMS. Data analysis was undertaken using Excel software. To preserve ethical aspects of the research, the names of hospitals were not mentioned; instead, they were numbered (from 1 to 14).The surgical wards were coded by the letters from (A to O). The Medical Ethics Committee of the Tehran University of
Medical Sciences approved this study. (IR.TUMS.VCR.REC.1397.1020).
Results
The findings have been presented in three sections. In the first one, the surgical wards have been evaluated according to the specialty. For example, all orthopedics wards have been grouped into one orthopedics department, and this was the same for all other wards. The second section is for the performance, which has been measured for these surgical wards at hospitals separately. In the third section, the performance of surgical departments, whose number was higher in TUMS hospitals, has also been measured separately.
According to Table 1, eye surgery has the highest percentage of BOR (111.50 %), while oral and maxillofacial surgery has the lowest percentage in the same regard (74.60 %). The ALOS in the cancer surgery department was 6.30 days, while the shortest was at the ophthalmology department (1.30 days). The highest BTR was in the eye surgery department (14.20 times), whereas the lowest was in the cardiothoracic surgery department (4.70 times).
Figure 1 shows the performance of surgical departments based on the Pabon Lasso diagram. The averages for BOR and BTR of the surgical departments during the study period were 80 % and seven times, respectively. The results revealed that five departments (33.31 %), including eye surgery, obstetrics and gynecology, vascular surgery, plastic surgery, and infertility, were Located in the third quadrant, and their performance was favorable. Of these, only the plastic surgery department has an ALOS of more than three days. Neurosurgery, urology, cancer surgery, cardiothoracic surgery, cardiac surgery, and orthopedics departments were in the fourth quadrant, and the shortest ALOS was in the urology department. The ENT and pediatric surgery departments were in quadrant 2, whereas the oral, maxillofacial, and general surgery departments were in quadrant 1. As displayed in Figure 1, the ALOS departments (more than five days) are all in the fourth quadrant. The departments with short ALOS (less than three days) are mainly located in the third quadrant.
The general surgery department operates in eight targeted hospitals. The average BOR and BTR in the general surgery departments were 74.90 % and 6.20, respectively. As shown in Figure 3, the distribution of wards in the four quadrants of the Pabon Lasso diagram was as follow; three (37.50 %) in quadrant one, three (37.50 %) in quadrant two, one (12.50 %) in quadrant three, and one (12.50 %) in quadrant four. The performance of the ward (A10) was better than other wards' performances. Meanwhile, the ward (A6) did have the weakest performance, so it was located in quadrant 1. Regarding BOR, there was a large difference between the wards; it was 89.40 % in the ward (A1) while it was 52.40 % for the ward (A6); accordingly, the variation of BOR in general surgery departments was 37 %.
In terms of BTR, there is also a greater variation between the general surgery wards. The ward (A14) was the most favorable in which BTR was 8.90 times while it was 2.50 times for the ward (A6), the range of BTR was 6.40 times. Concerning ALOS, there was also a difference between the general surgery wards at different hospitals. Three wards had an ALOS of less than three days, the ALOS in the other three wards ranged from 3 to 4 days, and it was from 4 to 5 days in the other two wards. The ALOS varied from 1.20 days to 5.30 days, then the variation in this indicator was 3.20 days. (Figure 3)
It was found that the department of obstetrics and gynecology was active at the five hospitals affiliated with TUMS. The average BOR and BTR of obstetrics and gynecology wards were 81.40 % and 10.70 times, respectively. Three wards were in quadrant 3 of the Pabon Lasso diagram, and two were in quadrant two. No ward was located in quadrant one or four. Furthermore, the BTR of all obstetrics and gynecology wards was higher than the average of other surgical wards. The ward (C3) had 91 % as BOR and 15 times as BTR, which was better than other related wards. The percentage of BOR in obstetrics and gynecology wards varied from 92.50 % in the ward (C9) to 62.50 % in the ward (C14), indicating a 30 % variation. The BTR also varied from 7.50 times in the ward (C1) to 15 times in the ward (C3), showing a difference of 7.50 times. The ALOS in obstetrics and gynecology wards was generally similar; patients usually stay in the four wards less than three days on average unless in the ward (C1) in which they stay more than four days. (Figure 4)
Similar to the department mentioned above, the urology department was also active just in four hospitals. The average BOR and BTR were 89.30 % and 6.30 times, respectively. As shown in figure 5, the two wards (H1) and (H12) are located in quadrant 4 of the Pabon Lasso diagram. One ward (H8) was located in quadrant three, and it was the only ward with a BTR higher than the average of other surgical wards. The ward (H9) had the poorest performance and is located in quadrant 1. The percentage of BOR in the urology wards varied from 95.01 % in the ward (H1) to 72.11 % in the ward (C14), indicating a 20.02 % variation. The BTR in urology wards varied from 5.20 times in the ward (H9) to 7.40 times in the ward (H8), showing a difference of 2.20 times. In terms of ALOS, it was presented in figure 5 that the urology wards are divided into two groups. The ALOS has ranged from three to four days in two wards and 4 to 5 days in two other wards. (Figure 5)
Discussion
The aim of this study was to evaluate the performance of inpatient surgical wards at the hospitals affiliated with TUMS in the period of study. The results showed that the average percentage of BOR and BTR in surgical departments was 80.00 % and seven times per month, respectively. Of 15, only five surgical departments, including eye surgery, obstetrics and gynecology, vascular surgery, plastic, and infertility, have located in quadrant three, and their performances were satisfactory. The ENT and pediatric surgery departments have located in quadrant two, for which the BOR was lower than the total average of surgical wards. The oral and maxillofacial surgery and general surgery departments were in quadrant one, and both of them did have the least performances among all wards.
The eye surgery, obstetrics and gynecology, vascular surgery, plastic, and infertility surgical wards were the best in terms of BOR and BTR. This can be due to the short ALOS, as most patients can leave the hospital shortly after surgery (29). Since the payment method of many surgeries related to eye and obstetrics and gynecology departments is the global payment, hospitals have an incentive to reduce the length of stay. Similar to this study findings, Hashemi et al. (30) have examined the indicators in hospital wards in Bushehr and found that ALOS in ophthalmology was less than three days. Another study showed that the ALOS in the obstetrics and gynecology ward was also less than three days (31).
The results of our study revealed that wards of neurosurgery, urology, cancer surgery, cardiothoracic surgery, cardiac surgery, and orthopedic surgery were in quadrant 4. One study conducted in the Indian neurosurgery departments showed that the ALOS in 2014 was 12 days (3), which is consistent with the present study results. In a recent study, the neurosurgery ward was in quadrant 3 of the Pabon Lasso diagram, but this was inconsistent with the results of the present study. The better performance of this ward could be attributed to the BOR and BTR, which were less than 45 % and 19 days, respectively. In this study, the average BOR and BTR in the general surgery department were 74.90 % and 6.20 times, respectively. A study carried out in one of the hospitals in Bandar Abbas has discovered that the BOR in the general surgery ward was 74.20 %, similar to the results of our study (30).
The average BOR and BTR of obstetrics and gynecology wards were 81.40 % and 10.70 times, respectively. The ALOS in the obstetrics and gynecology wards was generally similar; patients stayed in four wards (80.01 %) for an average of fewer than three days. In their study at Hazrat-e Rasool hospital in Tehran, Abadi et al. (32) have discovered that the average BOR was 65 % in the obstetrics and gynecology ward, and this indicator was 81.80 % for the same ward at Motahari hospital in Urmia in 2013 (33). The BOR in the current study was better and could be improved by increasing the hospitalization rate in general.
The average BOR and BTR in the urology wards were 89.30 % and 6.30 times, respectively. The ALOS in the two wards was three to four days, and meanwhile, it ranged from 4 to 5 days in the other two wards. In a study conducted in 2007, the BOR in the urology ward was 77.01 %, and the ALOS was four days (34). The hospitals in the present study were in better-off condition; this can be referred to the difference in beds number in this ward.
For more accurate analysis, the performance of the included wards in our study needs to be carried out by determining the type of patients and the complexity of treatment at those hospitals, consequently deciding based on the case mix and specialties at these hospitals. Generally, it should be noted that the wards in quadrants 1 and 2 are inefficient as their performance was poor. The reasons beyond the results related to the three indicators used in this study have to be demonstrated. For example, it may be recommended to transfer the vacant beds
from certain wards to other wards in case of underutilization, which will be useful in accomplishing more efficiency.
The BOR indicates the proper use of facilities, hospital resources, and the success of its management team in doing so. The ideal value of this indicator is 80-85 % depending on the nature of the hospital. The lower the value of this indicator means the loss of capacity; meanwhile, the potential capacity of the facilities can increase the cost of the services provided. Therefore, increasing BOR should be prioritized by hospital managers. The standard rate of BOR varies throughout hospitals and wards depending on the specialty and type of patients (acute and chronic illnesses). Some interventional practices can help raise the hospital BOR, such as activation of hospital outpatient clinics and emergency departments, recruiting well-qualified and highly-motivated physicians, avoiding the allocation of hospital beds to particular physicians, and allocating them according to the nature of the wards and morbidity rate in each ward instead (35).
The wards laying in quadrants 3 and 4 have almost no vacant beds. The wards in the third quadrant are performing well, and their capacity building is considered for further investigation (4). The long-term stay has driven some wards to the fourth quadrant of the Pabon Lasso diagram. Once again, the nature of the ward should also be taken into account, e.g., patients in cardiac or orthopedics surgery wards are expected to stay longer (24). However, it is necessary for these wards, in quadrant 4, to justify the logic behind the long stay of patients therein.
The irrational ALOS may be due to inadequate planning of the operating rooms, insufficient
para-clinical services, prolonged patient consultation time, laboratory testing and radiology services, and the lack of coordination between the medical staff (9, 36-38). Nosocomial infections, post-surgery complications, and patient dissatisfaction are the paramount adverse consequences of prolonged stay. Training of admission staff, raising patients' awareness, using new technologies and equipment, and hastening the discharge of patients are among the strategies for reducing the ALOS (38-41).
One of the issues that the managers should address is the variation in ALOS of patients in the same wards at different hospitals affiliated with TUMS. For example, the range of ALOS in the eight general surgery departments was 3.20 days. Although some of these changes can be attributed to the nature of diseases and the type of surgery, these claims need further articulation. Using standardized tools and procedures based on clinical practice guidelines can minimize these variations and provide more confidence to health outcomes.
Conclusion
Optimizing the utilization of hospital beds is essential in Iran to address the gaps in the development of medical centers. Given the current situation, the policymakers in the Ministry of Health and Medical Education in Iran should increase the per capita hospitalization nationwide and improve the utilization of available resources, including bed capacity, as a less expensive way to respond to society's needs. Using the methodology in this study, evaluating the hospitals' performance via emphasizing the hospital bed-related indicators can help identify the unused capacities vividly.
Assessment of hospitals' performance can help to identify inefficiency accurately. Understanding and comparing the performance of clinical departments is also useful in making decisions for standardizing the patterns of health services delivery, evidence-based management in health care centers, and enhancing accountability in the health system.
According to the results, it is suggested to revise the departments that were in the inefficient area. Also, due to the limited resources, facilities, and huge treatment costs, it is necessary to reduce the number of inefficient departments or attract more patients by marketing, diversifying services, and increasing the quality of services. Other solutions include directing these centers to outpatient services and establishing specialized clinics to promote efficiency.
To carry out more accurate evaluations, it is recommended that software be used to compare hospital performance at various intervals, increase the utilization of hospital resources, and prevent appropriate resource planning.
The limitations of this study are the lack of access to more data about hospitals and some important indicators for more detailed review. It is also suggested that the country's hospital departments be compared in terms of performance characteristics in future studies, and the reasons for their success and failure be determined.
Acknowledgments
The authors would like to thank all managers and staff of TUMS for their contribution to this research.
Conflict of interests
The authors declared no conflict of interests.
Authors' contributions
Dehnavi H, Khosravi MF, Gharasi-Manshadi M, Rezaee M, and Saeidpour J designed research; Dehnavi H, Khosravi MF, and Gharasi-Manshadi M conducted research; Dehnavi H, Khosravi MF, and Gharasi-Manshadi M analyzed data; and Dehnavi H, Khosravi MF, Gharasi-Manshadi M, M Rezaee, and Saeidpour J wrote the manuscript. All authors read and approved the final manuscript.
Funding
Non applicable
Methods: A descriptive, cross-sectional, retrospective study was performed at all hospitals affiliated with TUMS in 2018. To measure the efficiency of these wards, three indicators have been considered; bed occupancy rate, the average length of stay, and bed turnover. Data have been analyzed using Excel software based on the Pabon Lasso model .
Results: Among the 15 active surgical departments, 5 (33.31 %) were categorized in quadrant three, including ophthalmology, obstetrics and gynecology, vascular and trauma surgery, plastic surgery, and infertility department. The oral and maxillofacial surgery and general surgery departments were the poorest in their performance and located in quadrant one. Ten surgical wards out of 38 (26.33 %) have reported a satisfactory performance.
Conclusion: Understanding and comparing the performance of clinical departments is also useful in making decisions for standardizing the patterns of health services delivery, evidence-based management in health care centers, and enhancing accountability in the health system. It is suggested that managers revise the departments in the inefficient area to reduce the number of inefficient departments or attract more patients by marketing, diversifying services, and increasing the quality of services.
Keywords: Performance, Evaluation, Efficiency, Surgical ward, Pabon Lasso
Introduction
As one of the largest economic sectors, the health system is deemed one of the most important pillars of sustainable development and social welfare (1). Despite scientific progress and new technologies, management of the health system encounters many challenges such as increasing population, expectations of the growing community, and aging (2). These challenges have led to increased demand and expenditures for health services, which have impacted the quality and quantity of the provided healthcare (3). To address such challenges, health systems mainly have to focus on health facilities and strengthening the infrastructure of healthcare organizations such as hospitals (4).
Hospitals are among the most complex and costly components of the health system. Consequently, the way they operate has a major effect on health system resources and outcomes (5-7). The World Health Organization has identified hospitals as the predominant provider of health care and one of the predetermining factors for equitable distribution of health care and promoting fairness indicators in the health system (8). A large portion of the health budget is allocated for hospitals, 80 % and 40 % in developing and developed countries, respectively (9). These budgets could be accounted for the number of specialized professionals, sophisticated equipment, and the variety of used pharmaceuticals. Although the demand for hospital services is growing,
the estimated efficiency of hospitals doesn't exceed 50 %, which sheds light on poor managerial practices (10).
Given the vulnerable structures in developing countries, the importance of this inefficiency becomes greater (11, 12); therefore, special attention should be paid by managers and policymakers to the performance of hospitals, especially in economic and social constraints (13).
Evaluating the hospitals' performance seems necessary in light of their complexity, high costs, specialized services, and the importance of productivity and effectiveness of services. The hospitals consist of various wards, and the surgical ward is one of the most important wards of hospitals. Patients in need of surgery are operated on in this ward. The surgical department is very expensive in terms of construction, equipment, workforce, and management. Surgery account for a significant portion of hospital costs, followed by patient costs. Improving work processes can improve the quality of surgical services and patient satisfaction, reduce unnecessary costs, improve performance, and increase operating income (14). Evaluation can be defined as a method of analyzing the current situation and accurately measuring the system's performance based on the organizational goals and allocated resources (15). The evaluation system should be able to measure the organization's performance and compare it with similar organizations (16). In addition, applying an appropriate model for hospital performance evaluation can lead to increasing accountability, satisfaction, and improving service quality (17).
Different models and methods can be used to evaluate hospitals' performance. The most common way to evaluate hospitals' performance is to measure their efficiency (18). Based on its definition of maximizing the use of resources, the level of efficiency should be determined by a set of indicators appropriate for benchmarking (19). Continuous monitoring of each hospital's performance and comparing them with other hospitals is a useful tool for rationalizing resource allocation, organizing input resources, and improving health outcomes (20). In 1986, Pabon Lasso presented a model in Colombia for determining the relative hospitals' performance using three indicators; Bed Occupancy Rate (BOR), Bed Turnover Rate (BTR), and the Average Length Of Stay (ALOS) (21).
So far, several studies have been carried out in Iran to evaluate hospitals' performance using the Pabon Lasso model (3, 5, 22-25). In a study conducted in Ardabil, the results have shown that 42/01 % of the hospitals were in quadrant one, 35.72 % in quadrant 3, and 21.41 % in quadrant four. The ALOS, BOR, and BTR were 2.44 days, 55.40 %, and 80.80 times per year, respectively (4). At Kurdistan University of Medical Sciences, another study has revealed that 42.01 % of medical centers affiliated with the university were efficient as they located in quadrant 3 (26). A survey of 23 hospitals in Urmia stated that only 35 % of these hospitals were efficient (22). In total, most of the previous studies have shown that the capacity of hospital beds in Iran is not well-utilized (27).
Each of these studies has provided a picture of hospitals' performance in a specific region of the country, but so far, no study has been conducted to evaluate the different wards of hospitals in Iran. As a result, this study was conducted to evaluate the performance of the wards of TUMS in 2018 to provide hospital managers with a clear picture of the performance of each ward and to use strategies to improve it.
Materials and Methods
This is a descriptive, cross-sectional, and retrospective study aimed to evaluate the efficiency of surgical wards hospitals affiliated with TUMS (14 hospitals) between 21 March and 22 September 2018 (the first half of the solar calendar 1397). All surgical wards including general surgery, ear, nose, and throat (ENT), obstetrics and gynecology, pediatric, oral and maxillofacial surgery, neurosurgery, urology, plastic surgery, vascular surgery, orthopedics, eye surgery, cancer surgery, cardiothoracic surgery, cardiac surgery, infertility were included.
To evaluate the performance of inpatient surgical wards, the Pablon Lasso model was used. This model is one of the most useful models that can simultaneously compare performance indicators. Three indicators, including BOR, ALOS, and BTR, are hospital wards' most important performance indicators (28). The bed occupancy rate is a measure for the utilization of the available beds in the hospital. The average length of stay indicates the status of patient stay management in the hospital. The bed turnover rate is the number of times patients have used a hospital bed over a period of time.
These three indicators are placed on the X, Y, and Z axes, respectively. Accordingly, the wards will be distributed into four quadrants; quadrant 1 in which the wards are inefficient as having low BOR and BTR, quadrant two including the relatively- efficient wards of low BOR but high BTR, quadrant three, which embraces the efficiency of high BOR and BTR, and quadrant 4 in which the wards are relatively efficient with high BOR but low BTR. The latter category of wards is relatively efficient as the patients are admitted for a long period of time.
Since using the Pabon Lasso model, the studies have only evaluated the performance at the hospitals level. Meanwhile, hospitals have multiple inpatient departments, including surgery, internal medical, and special departments; therefore, measuring the performance across all departments in total is a small contribution to hospital managers as it does not determine the problematic department(s) precisely. Hence, it is better to demonstrate the location of each ward on the Pabon Lasso diagram rather than the overall hospital as a whole. By doing so, managers can better identify the inefficient wards and then take them into consideration in any upcoming improvement plan.
For the first time, we used the Pabon Lasso model to evaluate the performance of all inpatient surgical wards at hospitals affiliated with TUMS. Using this method, we can analyze and compare the performance of inpatient wards at each hospital and compare them with each other. This approach helps managers to evaluate the performance of medical departments in utilizing the hospital beds. Moreover, this perspective helps in planning to enhance efficiency to maximize the benefits of scarce resources and promote evidence-based management.
Data were collected after obtaining the necessary permissions by referring to the statistics unit of the Vice-Chancellor for Treatment Affairs at TUMS. Data analysis was undertaken using Excel software. To preserve ethical aspects of the research, the names of hospitals were not mentioned; instead, they were numbered (from 1 to 14).The surgical wards were coded by the letters from (A to O). The Medical Ethics Committee of the Tehran University of
Medical Sciences approved this study. (IR.TUMS.VCR.REC.1397.1020).
Results
The findings have been presented in three sections. In the first one, the surgical wards have been evaluated according to the specialty. For example, all orthopedics wards have been grouped into one orthopedics department, and this was the same for all other wards. The second section is for the performance, which has been measured for these surgical wards at hospitals separately. In the third section, the performance of surgical departments, whose number was higher in TUMS hospitals, has also been measured separately.
- Performance of surgical departments
According to Table 1, eye surgery has the highest percentage of BOR (111.50 %), while oral and maxillofacial surgery has the lowest percentage in the same regard (74.60 %). The ALOS in the cancer surgery department was 6.30 days, while the shortest was at the ophthalmology department (1.30 days). The highest BTR was in the eye surgery department (14.20 times), whereas the lowest was in the cardiothoracic surgery department (4.70 times).
Figure 1 shows the performance of surgical departments based on the Pabon Lasso diagram. The averages for BOR and BTR of the surgical departments during the study period were 80 % and seven times, respectively. The results revealed that five departments (33.31 %), including eye surgery, obstetrics and gynecology, vascular surgery, plastic surgery, and infertility, were Located in the third quadrant, and their performance was favorable. Of these, only the plastic surgery department has an ALOS of more than three days. Neurosurgery, urology, cancer surgery, cardiothoracic surgery, cardiac surgery, and orthopedics departments were in the fourth quadrant, and the shortest ALOS was in the urology department. The ENT and pediatric surgery departments were in quadrant 2, whereas the oral, maxillofacial, and general surgery departments were in quadrant 1. As displayed in Figure 1, the ALOS departments (more than five days) are all in the fourth quadrant. The departments with short ALOS (less than three days) are mainly located in the third quadrant.
- Performance of surgical wards
- Performance of surgical departments with more wards
The general surgery department operates in eight targeted hospitals. The average BOR and BTR in the general surgery departments were 74.90 % and 6.20, respectively. As shown in Figure 3, the distribution of wards in the four quadrants of the Pabon Lasso diagram was as follow; three (37.50 %) in quadrant one, three (37.50 %) in quadrant two, one (12.50 %) in quadrant three, and one (12.50 %) in quadrant four. The performance of the ward (A10) was better than other wards' performances. Meanwhile, the ward (A6) did have the weakest performance, so it was located in quadrant 1. Regarding BOR, there was a large difference between the wards; it was 89.40 % in the ward (A1) while it was 52.40 % for the ward (A6); accordingly, the variation of BOR in general surgery departments was 37 %.
In terms of BTR, there is also a greater variation between the general surgery wards. The ward (A14) was the most favorable in which BTR was 8.90 times while it was 2.50 times for the ward (A6), the range of BTR was 6.40 times. Concerning ALOS, there was also a difference between the general surgery wards at different hospitals. Three wards had an ALOS of less than three days, the ALOS in the other three wards ranged from 3 to 4 days, and it was from 4 to 5 days in the other two wards. The ALOS varied from 1.20 days to 5.30 days, then the variation in this indicator was 3.20 days. (Figure 3)
It was found that the department of obstetrics and gynecology was active at the five hospitals affiliated with TUMS. The average BOR and BTR of obstetrics and gynecology wards were 81.40 % and 10.70 times, respectively. Three wards were in quadrant 3 of the Pabon Lasso diagram, and two were in quadrant two. No ward was located in quadrant one or four. Furthermore, the BTR of all obstetrics and gynecology wards was higher than the average of other surgical wards. The ward (C3) had 91 % as BOR and 15 times as BTR, which was better than other related wards. The percentage of BOR in obstetrics and gynecology wards varied from 92.50 % in the ward (C9) to 62.50 % in the ward (C14), indicating a 30 % variation. The BTR also varied from 7.50 times in the ward (C1) to 15 times in the ward (C3), showing a difference of 7.50 times. The ALOS in obstetrics and gynecology wards was generally similar; patients usually stay in the four wards less than three days on average unless in the ward (C1) in which they stay more than four days. (Figure 4)
Similar to the department mentioned above, the urology department was also active just in four hospitals. The average BOR and BTR were 89.30 % and 6.30 times, respectively. As shown in figure 5, the two wards (H1) and (H12) are located in quadrant 4 of the Pabon Lasso diagram. One ward (H8) was located in quadrant three, and it was the only ward with a BTR higher than the average of other surgical wards. The ward (H9) had the poorest performance and is located in quadrant 1. The percentage of BOR in the urology wards varied from 95.01 % in the ward (H1) to 72.11 % in the ward (C14), indicating a 20.02 % variation. The BTR in urology wards varied from 5.20 times in the ward (H9) to 7.40 times in the ward (H8), showing a difference of 2.20 times. In terms of ALOS, it was presented in figure 5 that the urology wards are divided into two groups. The ALOS has ranged from three to four days in two wards and 4 to 5 days in two other wards. (Figure 5)
Table 1. Performance of surgical departments of TUMS between 21 March and 22 September 2018
.png)
Figure 1. The performance of surgical departments at the hospitals affiliated with Tehran University of Medical Sciences between 21 March and 22 September 2018

Figure 2. The performance of surgical wards at hospitals affiliated with Tehran University of Medical Sciences hospitals between 21 March and 22 September 2018

Figure 3. Performance of general surgery wards at the hospitals affiliated with Tehran University of Medical Sciences between 21 March and 22 September 2018
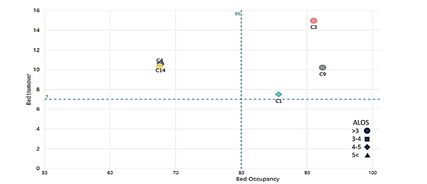
Figure 4. Performance of obstetrics and gynecology wards at the hospitals affiliated with Tehran University of Medical Sciences between 21 March and 22 September 2018
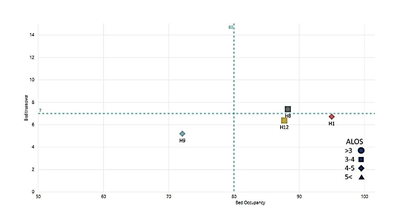
Figure 5. Performance of urology wards Performance at the hospitals affiliated with Tehran University of Medical Sciences between 21 March and 22 September 2018
| Surgical department | Code | No. of wards at the university hospitals | Beds | BOR | BTR | ALOS | |
| Number | Percentage (%) | ||||||
| General Surgery | A | 8 | 354 | 21.65 | 74.90 | 6.20 | 3.30 |
| ENT | B | 2 | 116 | 7.09 | 77.40 | 9.10 | 2.90 |
| Obstetrics and Gynecology | C | 5 | 179 | 10.95 | 81.40 | 10.70 | 2.00 |
| Pediatric Surgery | D | 2 | 74 | 4.53 | 74.80 | 7.40 | 3.00 |
| Oral and Maxillofacial Surgery | E | 2 | 29 | 1.77 | 74.70 | 6.10 | 3.70 |
| Neurosurgery | F | 3 | 83 | 5.08 | 86.30 | 5.70 | 4.20 |
| Urology | G | 4 | 80 | 4.89 | 89.30 | 6.30 | 3.80 |
| Plastic Surgery | H | 2 | 45 | 2.75 | 80.30 | 8.00 | 3.60 |
| Vascular Surgery | I | 1 | 49 | 3.00 | 81.50 | 8.30 | 2.40 |
| Orthopedics | J | 3 | 127 | 7.77 | 80.30 | 4.80 | 4.60 |
| Eye Surgery | K | 1 | 216 | 13.21 | 111.50 | 14.20 | 1.30 |
| Cancer Surgery | L | 1 | 118 | 7.22 | 94.10 | 5.50 | 6.00 |
| Cardiothoracic Surgery | M | 1 | 19 | 1.16 | 85.80 | 4.80 | 4.90 |
| Cardiac Surgery | N | 2 | 138 | 8.44 | 88.00 | 6.10 | 5.00 |
| Infertility | O | 1 | 8 | 0.49 | 93.50 | 11.90 | 2.60 |
Figure 1. The performance of surgical departments at the hospitals affiliated with Tehran University of Medical Sciences between 21 March and 22 September 2018
Figure 2. The performance of surgical wards at hospitals affiliated with Tehran University of Medical Sciences hospitals between 21 March and 22 September 2018
Figure 3. Performance of general surgery wards at the hospitals affiliated with Tehran University of Medical Sciences between 21 March and 22 September 2018
Figure 4. Performance of obstetrics and gynecology wards at the hospitals affiliated with Tehran University of Medical Sciences between 21 March and 22 September 2018
Figure 5. Performance of urology wards Performance at the hospitals affiliated with Tehran University of Medical Sciences between 21 March and 22 September 2018
Discussion
The aim of this study was to evaluate the performance of inpatient surgical wards at the hospitals affiliated with TUMS in the period of study. The results showed that the average percentage of BOR and BTR in surgical departments was 80.00 % and seven times per month, respectively. Of 15, only five surgical departments, including eye surgery, obstetrics and gynecology, vascular surgery, plastic, and infertility, have located in quadrant three, and their performances were satisfactory. The ENT and pediatric surgery departments have located in quadrant two, for which the BOR was lower than the total average of surgical wards. The oral and maxillofacial surgery and general surgery departments were in quadrant one, and both of them did have the least performances among all wards.
The eye surgery, obstetrics and gynecology, vascular surgery, plastic, and infertility surgical wards were the best in terms of BOR and BTR. This can be due to the short ALOS, as most patients can leave the hospital shortly after surgery (29). Since the payment method of many surgeries related to eye and obstetrics and gynecology departments is the global payment, hospitals have an incentive to reduce the length of stay. Similar to this study findings, Hashemi et al. (30) have examined the indicators in hospital wards in Bushehr and found that ALOS in ophthalmology was less than three days. Another study showed that the ALOS in the obstetrics and gynecology ward was also less than three days (31).
The results of our study revealed that wards of neurosurgery, urology, cancer surgery, cardiothoracic surgery, cardiac surgery, and orthopedic surgery were in quadrant 4. One study conducted in the Indian neurosurgery departments showed that the ALOS in 2014 was 12 days (3), which is consistent with the present study results. In a recent study, the neurosurgery ward was in quadrant 3 of the Pabon Lasso diagram, but this was inconsistent with the results of the present study. The better performance of this ward could be attributed to the BOR and BTR, which were less than 45 % and 19 days, respectively. In this study, the average BOR and BTR in the general surgery department were 74.90 % and 6.20 times, respectively. A study carried out in one of the hospitals in Bandar Abbas has discovered that the BOR in the general surgery ward was 74.20 %, similar to the results of our study (30).
The average BOR and BTR of obstetrics and gynecology wards were 81.40 % and 10.70 times, respectively. The ALOS in the obstetrics and gynecology wards was generally similar; patients stayed in four wards (80.01 %) for an average of fewer than three days. In their study at Hazrat-e Rasool hospital in Tehran, Abadi et al. (32) have discovered that the average BOR was 65 % in the obstetrics and gynecology ward, and this indicator was 81.80 % for the same ward at Motahari hospital in Urmia in 2013 (33). The BOR in the current study was better and could be improved by increasing the hospitalization rate in general.
The average BOR and BTR in the urology wards were 89.30 % and 6.30 times, respectively. The ALOS in the two wards was three to four days, and meanwhile, it ranged from 4 to 5 days in the other two wards. In a study conducted in 2007, the BOR in the urology ward was 77.01 %, and the ALOS was four days (34). The hospitals in the present study were in better-off condition; this can be referred to the difference in beds number in this ward.
For more accurate analysis, the performance of the included wards in our study needs to be carried out by determining the type of patients and the complexity of treatment at those hospitals, consequently deciding based on the case mix and specialties at these hospitals. Generally, it should be noted that the wards in quadrants 1 and 2 are inefficient as their performance was poor. The reasons beyond the results related to the three indicators used in this study have to be demonstrated. For example, it may be recommended to transfer the vacant beds
from certain wards to other wards in case of underutilization, which will be useful in accomplishing more efficiency.
The BOR indicates the proper use of facilities, hospital resources, and the success of its management team in doing so. The ideal value of this indicator is 80-85 % depending on the nature of the hospital. The lower the value of this indicator means the loss of capacity; meanwhile, the potential capacity of the facilities can increase the cost of the services provided. Therefore, increasing BOR should be prioritized by hospital managers. The standard rate of BOR varies throughout hospitals and wards depending on the specialty and type of patients (acute and chronic illnesses). Some interventional practices can help raise the hospital BOR, such as activation of hospital outpatient clinics and emergency departments, recruiting well-qualified and highly-motivated physicians, avoiding the allocation of hospital beds to particular physicians, and allocating them according to the nature of the wards and morbidity rate in each ward instead (35).
The wards laying in quadrants 3 and 4 have almost no vacant beds. The wards in the third quadrant are performing well, and their capacity building is considered for further investigation (4). The long-term stay has driven some wards to the fourth quadrant of the Pabon Lasso diagram. Once again, the nature of the ward should also be taken into account, e.g., patients in cardiac or orthopedics surgery wards are expected to stay longer (24). However, it is necessary for these wards, in quadrant 4, to justify the logic behind the long stay of patients therein.
The irrational ALOS may be due to inadequate planning of the operating rooms, insufficient
para-clinical services, prolonged patient consultation time, laboratory testing and radiology services, and the lack of coordination between the medical staff (9, 36-38). Nosocomial infections, post-surgery complications, and patient dissatisfaction are the paramount adverse consequences of prolonged stay. Training of admission staff, raising patients' awareness, using new technologies and equipment, and hastening the discharge of patients are among the strategies for reducing the ALOS (38-41).
One of the issues that the managers should address is the variation in ALOS of patients in the same wards at different hospitals affiliated with TUMS. For example, the range of ALOS in the eight general surgery departments was 3.20 days. Although some of these changes can be attributed to the nature of diseases and the type of surgery, these claims need further articulation. Using standardized tools and procedures based on clinical practice guidelines can minimize these variations and provide more confidence to health outcomes.
Conclusion
Optimizing the utilization of hospital beds is essential in Iran to address the gaps in the development of medical centers. Given the current situation, the policymakers in the Ministry of Health and Medical Education in Iran should increase the per capita hospitalization nationwide and improve the utilization of available resources, including bed capacity, as a less expensive way to respond to society's needs. Using the methodology in this study, evaluating the hospitals' performance via emphasizing the hospital bed-related indicators can help identify the unused capacities vividly.
Assessment of hospitals' performance can help to identify inefficiency accurately. Understanding and comparing the performance of clinical departments is also useful in making decisions for standardizing the patterns of health services delivery, evidence-based management in health care centers, and enhancing accountability in the health system.
According to the results, it is suggested to revise the departments that were in the inefficient area. Also, due to the limited resources, facilities, and huge treatment costs, it is necessary to reduce the number of inefficient departments or attract more patients by marketing, diversifying services, and increasing the quality of services. Other solutions include directing these centers to outpatient services and establishing specialized clinics to promote efficiency.
To carry out more accurate evaluations, it is recommended that software be used to compare hospital performance at various intervals, increase the utilization of hospital resources, and prevent appropriate resource planning.
The limitations of this study are the lack of access to more data about hospitals and some important indicators for more detailed review. It is also suggested that the country's hospital departments be compared in terms of performance characteristics in future studies, and the reasons for their success and failure be determined.
Acknowledgments
The authors would like to thank all managers and staff of TUMS for their contribution to this research.
Conflict of interests
The authors declared no conflict of interests.
Authors' contributions
Dehnavi H, Khosravi MF, Gharasi-Manshadi M, Rezaee M, and Saeidpour J designed research; Dehnavi H, Khosravi MF, and Gharasi-Manshadi M conducted research; Dehnavi H, Khosravi MF, and Gharasi-Manshadi M analyzed data; and Dehnavi H, Khosravi MF, Gharasi-Manshadi M, M Rezaee, and Saeidpour J wrote the manuscript. All authors read and approved the final manuscript.
Funding
Non applicable
Type of Study: Original article |
Subject:
Healt care Management
Received: 2021/04/18 | Accepted: 2021/10/28 | Published: 2021/10/28
Received: 2021/04/18 | Accepted: 2021/10/28 | Published: 2021/10/28
References
1. Pourmohammadi K, Shojaei P, Rahimi H, Bastani P. Evaluating the health system financing of the Eastern Mediterranean Region (EMR) countries using Grey Relation Analysis and Shannon Entropy. Cost Effectiveness and Resource Allocation. 2018; 16(1): 31. [DOI: 10. 1186/s12962-018-0151-6]
2. Scott A, Yong J. Do new workforce roles reduce waiting times in ED? A difference-in-difference evaluation using hospital administrative data. Health Policy. 2015; 119(4): 488-93.
3. Tripathi CB, Kumar R, Sharma RC, Agarwal R. Assessment of performance of services in a tertiary care Neuropsychiatric Institute using Pabon Lasso model. Asian Journal of Medical Sciences. 2016; 7(6): 69-74.
4. Adham D, Panahi M, Barfar IS, Ameri H, Sadeghi G, Salarikhah E. Contemporary use of hospital efficiency indicators to evaluate hospital performance using the Pabon Lasso Model. European Journal of Business Social Sciences. 2014; 3(2): 1-8.
5. Najafi S, Mahmoudi Gh, Dabbaghi F, Moradian M. Comparison of performance of hospitals in Mazandaran Province with the approach of the Pabon Lasso model and based on the type of ownership. Journal oF Organizational Behavior Research. 2018; 3(2): 2-4.
6. Ravaghi H, Afshari M, Isfahani P, Bélorgeot VD. A systematic review on hospital inefficiency in the Eastern Mediterranean Region: Sources and solutions. BMC Health Services Research. 2019; 19(1): 830.
7. Amoozadeh A, Shahverdi R, Rezaei Balf F. Comparison of relative efficiency of hospitals affiliated to Babol and Mazandaran Universities of Medical Sciences before and after health development plan with data envelopment analysis method. Journal of Babol University of Medical Sciences. 2018; 20(1): 68-4. [In Persian]
8. Shaw C. How can hospital performance be measured and monitored?: World Health Organization Regional Office for Europe; 2003. Available from URL: https://www.euro.who.int/ en/data-and-evidence/evidence-informed-policy-making/publications/pre2009/how-can-hospital-performance-be-measured-and-monitored. Last access: May 10, 2021.
9. Bouckaert N, Van den Heede K, Van de Voorde C. Improving the forecasting of hospital services: A comparison between projections and actual utilization of hospital services. Health Policy. 2018 122(7): 728-36. [DOI: 10.1016/j.healthpol. 2018.05.010]
10. Mohammadi M, Ziapoor A, Mahboubi M, Faroukhi A, Amani N, Hydarpour F, et al. Performance evaluation of hospitals under supervision of Kermanshah Medical Sciences using pabonlasoty diagram of a five-year period (2008-2012). J Life Sci J. 2014; 11(1): 77-81.
11. Parvaresh M, Esfandnia A. Investigation of Iranian Hospitals' efficiency using Pabon Lasso model: Systematic review. Annals of Tropical Medicine Public Health. 2017; 10(4): 884. [DOI: 10.4103/ATMPH.ATMPH_238_17]
12. Barouni M, Amiresmaieli MR, Shahravan A, Amini S. The efficiency assessment of dental units using data envelopment analysis approach: The case of Iran. Iran J Public Health. 2017; 46(4): 552.
13. Bahadori MK, Izadi AR, Ghardashi F, Ravangard R, Hosseini SM. The evaluation of hospital performance in Iran: a systematic review article. Iranian Journal of Public Health. 2016; 45(7): 855-66.
14. Mosadeghrad AM, Afshari M. The impact of quality management on income of operating theatre in a hospital: brief report. Tehran University Medical Journal. 2018; 75(10): 768-72. [In Persian]
15. Sadghiani A. Textbook of Hospital Organization and Management. 1 ed. Tehran: Jahan rayaneh; 1999. p151-9.
16. Hooshmand E, Zomorodi Niat H, Ebrahimipour H, Esmaili HA, Vafaee Najar A. Designing a performance evaluation model based on balanced score card and analytic hierarchy process methods: Montaserieh Hospital. 2018; 7(2).
17. Taslimi MS, Zayandeh M. Challenges of hospital performance assessment system development: Literature review. Hakim Health Systems Research Journal. 2013; 16(1): 35-41.
18. Varabyova Y, Schreyögg J. International comparisons of the technical efficiency of the hospital sector: Panel data analysis of OECD countries using parametric and non-parametric approaches. Health Policy. 2013; 112(1-2): 70-9. [DOI: 10.1016/j.healthpol.2013.03.003]
19. Farrell MJ. The measurement of productive efficiency. Journal of the Royal Statistical Society: Series A (General). 1957; 120(3): 253-90.
20. Haji Ali Afzali H, Moss JR, Mohammad Afzal M. A conceptual framework for selecting the most appropriate variables for measuring hospital efficiency with a focus on Iranian public hospitals. Health Serv Manage Res. 2009; 22(2): 81-91. [DOI: 10.1258/hsmr.2008.008020]
21. Pabon Lasso H. Evaluating hospital performance through simultaneous application of several indicators. 1986. Avaiable from URL: https://iris.paho.org/bitstream/handle/10665.2/27221/ev20n4p341.pdf?sequence = 1. Last access: May 10, 2021.
22. Bahadori Mk, Sadeghifar J, Hamouzadeh P, Hakimzadeh SM, Nejati M. Combining multiple indicators to assess hospital performance in Iran using the Pabon Lasso model. Australas Med J. 2011; 4(4): 175. [DOI: 10.4066/AMJ. 2011.620]
23. Mehrtak M, Yusefzadeh H, Jaafaripooyan E. Pabon Lasso and Data Envelopment Analysis: A complementary approach to hospital performance measurement. Glob J Health Sci. 2014; 6(4): 107. [DOI: 10.5539/gjhs.v6n4p107]
24. Goshtasebi A, Vahdaninia M, Gorgipour R, Samanpour A, Maftoon F, Farzadi F, et al. Assessing hospital performance by the Pabon Lasso model. Iranian Journal of Public Health. 2009; 38(2): 119-24.
25. Naghavian M, Naghshine A, Abdi M, Jahani MA. The evaluation of performance indicators in the health care centers of Babol University of Medical Sciences by the Pabon Lasso model (2011-2014). Journal of Babol University of Medical Sciences. 2015; 17(3): 76-82.
26. Miraki T, Rezaei S, Jahanmehr N, Mohammadi M, Gharibi F. Assessment of performance of the hospitals of Kurdistan University of Medical Sciences by use of Pabon Lasso model (2007-2011). Scientific Journal of Kurdistan University of Medical Sciences. 2014; 19(1): 114-23. [In Persian] [DOI: 10.22102/19.1.114]
27. Mosadeghrad AM, Dehnavi H. Evaluation of hospital performance in Iran: A systematic review and meta-analysis. Payesh. 2018; 17(6): 603-15. [In Persian]
28. Moghadamnia AA, Jahani MA, Bijani A, Yaminfirooz M, Naghshineh A, Mohammadnia K. Evaluation of performance indicators and frequency of patient referrals in the hospitals affiliated to Babol University of Medical Sciences in 2013. Journal of Babol University of Medical Sciences. 2016; 18(5): 61-9.
29. Casalino E, Perozziello A, Choquet C, Curac S, Leroy C, Hellmann R. Evaluation of hospital length of stay and revenues as a function of admission mode, clinical pathways including observation unit stay and hospitalization characteristics. Health Services Management Research. 2018; 32(1): 16-25.
30. Hashemi N, Heidarinejad Z, Farhani nezhad S, kashani S. Comparison of performance indicators in Shahid Mohammadi hospital with national standards. Journal of Modern Medical Information Sciences. 2018; 4(1): 1-8. [In Persian]
31. Ravangard R, Arab M, Zeraati H, Rashidian A, Akbarisari A, Niroomand N, et al. A study of patient length of stay in Tehran University of Medical Sciences Obstetrics and Gynecology Specialty Hospital and its associated clinical and nonclinical factors. Hakim Research Journal. 2010; 13(2): 129-36. [In Persian]
32. Ebadi Fard Azar F, Choopani A, Saberi Anari H, Mohammadi N, Arkian S, Choopani F. Comparing performance indicators of obstetric and gynecology ward with expected limits of indicators. Journal of Hospital. 2012; 11(1): 51-62. [In Persian]
33. Rahimi B, Balamji M, Rashid A, Lotfnezhad Afshr H, Zare Fazlollahi Z, Jabraeili M. Assessing performance indicators of obstetrics and gynecology ward with expected limits of indicators at Motahari University Hospital In 2013. Journal of Urmia Nursing Midwifery Faculty. 2016; 14(5): 407-16. [In Persian]
34. Jonaidi N, Sadeghi M, Izadi M, Ranjbar R. Comparison of performance indicators in one of hospitals of Tehran with national standards. Ran J Mil Med. 2011; 12(4): 223-8.
35. Yaghoubi M, Soltani Zarandi MR, Rahmati-Najarkolaei F. Factors affecting bed occupancy rate based on multiple-criteria decision analysis (hierarchical analysis) in a military hospital. Journal Mil Med. 2017;19(4): 344-50. [In Persian]
36. Toroski M, Golmakani E, Sodagar HR, Hosseini SH, Rajabzadeh R, Borhaninejad VR, et al. Survey of bed efficiency for hospitals of North Khorasan University of Medical Sciences by using standard functional criteria of the Ministry of Health. Journal of North Khorasan University of Medical Sciences. 2014; 6(3): 637-44. [ In Persian] [DOI: 10.29252/jnkums.6.3.637]
37. Xiao J, Douglas D, Lee AH, Vemuri SR. A Delphi evaluation of the factors influencing length of stay in Australian hospitals. The International Journal of Health Planning Management. 1997; 12(3): 207-18.
38. Yaghoubi M, Karimi S, ketabi S, Javadi M. Investigating the factors affecting the length of patients' stay in Alzahra Medical Center based on hierarchical analysis. Health Information Management. 2010; 2(3): 6-8. [In Persian]
39. Amiresmaili MR, Mosleh A, Isfahani P, Emami M. The effective factors in improving hospital performance indicators from the viewpoint of Zabol hospital, Iran, Managers. Journal of Health Development. 2012; 1(1): 56-66. [In Persian]
40. Arab M, Zarei A, Rahimi A, Rezaiean F, Akbari F. Analysis of factors affecting length of stay in public hospitals in Lorestan province, Iran. Hakim Research Journal. 2010; 12(4): 27-32. [In Persian]
41. Yaghoubi M, Agha Rahimi Z, Javadi M. Factors affecting in productivity index in Noor & Ali Asghar Hospital in Esfahan base on hierarchical analysis process technique. Health Inf Manage. 2013;10(4): 1-9. [In Persian]
Send email to the article author
| Rights and permissions | |
 |
This work is licensed under a Creative Commons Attribution-NonCommercial 4.0 International License. |
