

Volume 7, Issue 1 (3-2023)
EBHPME 2023, 7(1): 38-50 |
Back to browse issues page


Download citation:
BibTeX | RIS | EndNote | Medlars | ProCite | Reference Manager | RefWorks
Send citation to:


BibTeX | RIS | EndNote | Medlars | ProCite | Reference Manager | RefWorks
Send citation to:
Safi E, Amirfakhriyan M, Ameri H, Zare H, Ranjbar M, Assefa Y. Spatial Accessibility to Primary Healthcare Facilities in Iran: A GIS-Based Approach. EBHPME 2023; 7 (1) :38-50
URL: http://jebhpme.ssu.ac.ir/article-1-420-en.html
URL: http://jebhpme.ssu.ac.ir/article-1-420-en.html
Elham Safi 

 , Mostafa Amirfakhriyan , Hosein Ameri , Hossein Zare , Mohammad Ranjbar * , Yibeltal Assefa
, Mostafa Amirfakhriyan , Hosein Ameri , Hossein Zare , Mohammad Ranjbar * , Yibeltal Assefa
Health Policy & Management Research Center, School of Public Health, Shahid Sadoughi University of Medical Sciences, Yazd, Iran , ranjbar3079@gmail.com
Full-Text [PDF 1581 kb]
(137 Downloads)
| Abstract (HTML) (431 Views)
Full-Text: (73 Views)
A B S T R A C T
Background: Primary healthcare facilities are essential to provide healthcare to individuals and the society closer to home. Fast, timely, and affordable access to these centers is important in each society. This is especially crucial to prevent and control the epidemics of non-communicable diseases that are highly affecting populations in urban settings. This study aimed to assess spatial accessibility to primary healthcare facilities in Yazd city (Iran), using a Geographic Information System (GIS).
Methods: In this descriptive-analytical study, which was conducted cross-sectionally in 2022, locational information related to primary healthcare centers, population distribution, and urban zoning of Yazd city were collected and recorded in Excel format. Then, distribution maps of each of the studied uses were determined. Then, the existing indicators and standards regarding the uses were determined through documentary studies, and a geographic database was formed through the GIS software collection. Data were analyzed using indicators and models such as hot spot analysis, Thiessens polygons algorithm, access model based on the two-step floating catchment area, and the average distance model of the nearest neighbor.
Results: The results indicated that the comprehensive health centers in Yazd city are located next to each other with a scattered distribution pattern, and are away from each other by an average distance of 1131 meters. Also, the distance of urban health posts from each other is 1045 meters on average, and are randomly located next to each other. The main concentration of the distribution of primary health care facilities is observed in the central and traditional regions of the city, which, according to the hot spot analysis, are among the cold and low population density spots. In addition, the access score of the regions indicates that the distribution of these facilities is not according to the population density, and the highest functional pressure of comprehensive health centers as well as urban health posts is observed in the regions where there is the least access to these facilities.
Conclusion: There is a disparity between the distribution of primary healthcare facilities and population density in Yazd city, Iran. This study provides significant evidence to local health policymakers and urban planners to design more efficient actions related to equal development of health infrastructure by using the GIS.
Key words: Spatial accessibility, Primary health care, GIS, Equity
Introduction
Primary Health Care (PHC) is known as an important facilitator of overall population health )1(; and poor access to this care can affect people's lives and survival )2(. The optimal allocation of health resources is achieved to match the provision of healthcare with social and economic needs through improving access to PHC services, reducing waiting time, meeting the health and treatment needs of the population, and increasing the overall quality of life )3(. It is also very important for the provision and distribution of healthcare and the general objective of universal health coverage )4(.
In addition, sufficient access to PHC is one of the vital elements for having an advanced society )5(. The World Health Organization (WHO), under the concept of human rights, defines access to healthcare as physical, safe, and reasonable availability for all people, especially the vulnerable and marginalized groups, ethnic minorities and indigenous people, women, children, elderly groups and people with disabilities )5(. The level of access to healthcare services depends on many factors including the unique topography of each city, its spatial pattern, and planning or lack of planning. This makes the level of access to healthcare services is variable across cities )6(.
Four dimensions of accessibility have been identified, including (a) availability, (b) geographical dimension that is related to the physical location, (c) acceptability and (d) affordability. The first two dimensions of
access are related to geographic or spatial accessibility )7(. Healthcare access problems include assessing the adequacy of the number of healthcare facilities and the appropriate distribution of these facilities to ensure easy and immediate access to a healthcare center for every patient who needs it, affordability, and therefore access to quality healthcare for all patients )4, 8(.
Since the 1980s, the use of spatial accessibility to healthcare services has become prominent. Healthcare access can be defined as the capacity of a person or population to enter the health system, which has spatial, organizational, and financial dimensions )9(. Spatial dimensions of access such as healthcare capacity (e.g., quality and quantity of medical equipment, doctors, or patient beds), patient socioeconomic aspects (e.g., status, income, age, and gender), and population demand )7(.
Spatial accessibility is defined as the location of healthcare facilities regarding the location of the people who need them. It also refers to the relative ease with which people can access healthcare facilities from a given location. The distance a person must travel to get to healthcare facilities is a key factor that should be considered when measuring spatial accessibility )7, 10(.
Geospatial techniques are widely used in various fields of health service studies to maximize geographic access to healthcare services. Analysis of access to healthcare based on GIS is a logical method that can be used to evaluate the level of equitable access )11, 12(.
At the global level, since GIS has analytical capabilities and dynamic image display, it is considered a widely used technology in health system planning )13-15(. GIS is designed for storing, managing, and displaying spatial data and helping the analysis and interpretation of these data )16(. These systems have important tools that can help the planning of healthcare services and decision-making processes. These tools include database management, planning, risk assessment, service area mapping, location identification and access tools )4(.
Since one of the criteria of sustainable urban development and social justice is to pay attention to the balanced distribution of urban services and facilities, the distribution of services in the city should therefore be in a way that establishes the best relationship with the discussion of social justice. Planners try to optimize the distribution of service centers in cities, and this distribution is proportional to the distribution of the population and the amount of demand in various parts of the city )17(.
Previous studies have proven that spatial barriers between people and healthcare facilities reduce access to healthcare and the use of preventive services )1, 2, 8, 12, 15, 18(. The rational distribution of healthcare facilities ensures equal access to the public to benefit from essential services, thereby eliminating spatial polarization and reducing spatial differentiation, which is significant for urban development )2(. The existence of available healthcare facilities is vital for service quality and public satisfaction. Therefore, it is important to examine the distribution and availability of PHC facilities in cities and consider the importance and necessity of equal access of people to healthcare services, in creating a healthy population, which is one of the signs of countries development, this study aimed to assess spatial accessibility to PHC facilities in Yazd city (Iran), using GIS.
Materials and Methods
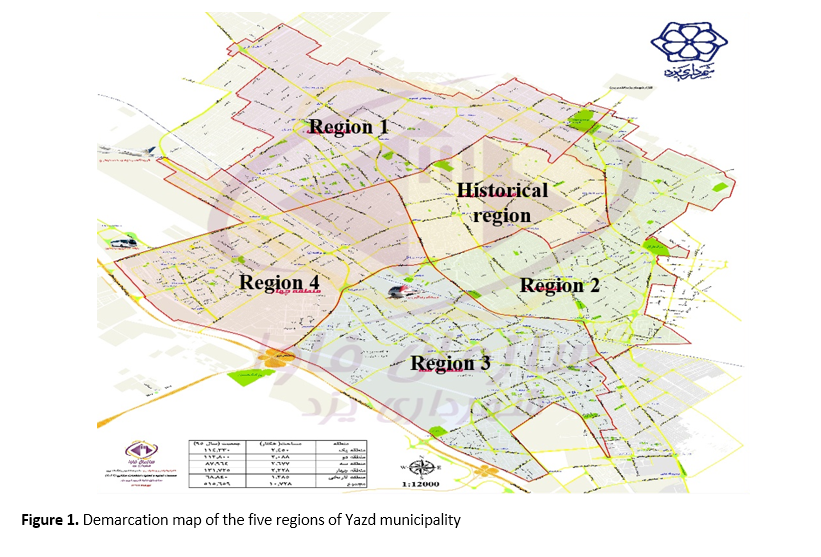
In this descriptive-analytical study, which was conducted in 2022, all PHC facilities in Yazd city were studied. Yazd city is the second "crude clay" and "historic" city in the world, which is the capital of Yazd province in the center of Iran. The population of Yazd city was 557,634 people in 2020. Yazd city has 5 municipal regions, which are shown on the map below (Figure 1).
Primary healthcare services in Yazd city is provided through fifty-nine centers (19 comprehensive health center and 40 urban health post). To collect the required data, the information related to the addresses of all the mentioned users was obtained from the health deputy of the Yazd University of Medical Sciences and Yazd Municipality and recorded in an Excel form. Then, using the available information, the distribution maps of each of the PHC centers were determined. Afterward, through documentary studies, the existing indicators and standards regarding the uses were determined, and then the geographic database was formed through the GIS software collection. Then, the data were analyzed using indicators and models such as hot spot analysis, Thiessen's polygons algorithm, access model based on the Two-step floating catchment area, and the average distance model of the nearest neighbor.
A) Euclidean distance (Distance Eqladian) (19)
It represents the direct distance between two points without considering complications. In other
words, this distance considers the distance between two complications without considering the communication network, which is also called direct distance or spatial or aerial distance
(Figure 2).
B) Thiessen's polygons algorithm (19)
From among the important criteria for measuring access, we can refer to the number of user population for each healthcare facility. That is, how much is the per capita population for each healthcare facility. Using Thiessens polygons algoritm (irregular polygonal surfaces), first, the functional radius of each healthcare use was obtained separately, and then the population located in each polygon was calculated. Finally, while using the population statistics of each region and determining the proportion of each use, the calculated values of the population using healthcare uses were normalized.
C) Model accessibility (19)
In previous studies, various methods have been used to analyze spatial accessibility. These methods can be classified into three categories:
a) Access based on the distance between the population and the facilities
b) Access based on the service radius of the facility and the population covered by each service
c) Access based on the number of facilities available to people
In each stage, different methods and models have been proposed by researchers to calculate the amount of access. But each of these methods has advantages and disadvantages. Their main disadvantage is that access is a combination of various methods, whereas the mentioned methods have only paid attention to one aspect of it, they therefore, lack comprehensiveness. For this reason, models based on the "Two-step floating catchment area" model (Wang & Luo, 2005) have been presented, in which spatial accessibility to services is considered as a function of the following factors:
- The number of populations using the facility: if the number is more, there is less opportunity for the population to use the facility and vice versa.
- The distance from the facilities: the smaller the distance between the users and the source of the facility, the easier and better it will be for people to access services.
- Selection options: If people have more selection options regarding the use of facilities, they will certainly have better access.
In this study, according to the type of variables and values available for each of them, a method called ACCESS was used, which is based on ARC GIS software. For this purpose, the functional radius and privacy of each of the PHC facilities in Yazd city were determined on the network. This value was determined based on existing standards. Then, it was measured whether the population area is located within the boundaries of multiple PHC facilities or in other words, it has appropriate access to several PHC facilities. After that, the distance of each population area to the nearest PHC facilities around it was calculated and using the following relationship, the access score of each population area to each of the PHC facilities was obtained:
ri: Is also obtained from the following relation:
di: The average network distance between the population of each range and the facility options that can be selected for it:
ni: Number of facilities use choices for the population of each range
pi: Number of populations in each range
To calculate this index, the required information was stored in two separate layers with the names of the healthcare uses layer by their type and the population blocks layer in the geographic information system database, and the access scores were conducted for each of the demographic blocks within the framework of six steps as the followings:
First step: Considering the existing standards about the distance of each person to PHC facilities according to their type. For this reason, many sources and previous studies were used.
Second step: At this step, the nearest facility for each demographic block and its distance were determined. In other words, at this step, it was determined which facilities the demographic block is close to and how far they are from it. The layer resulting from this process was named the "distance to facilities" layer.
Third step: The demographic information related to each block was linked to the "distance to facilities" layer using the “JOIN” command. The result of this process was the creation of a new layer in which the distance to the nearest facilities and the population of each block was determined.
Fourth step: The layer created in the third step was linked to the functional radius layer of PHC facilities (the result of the first step) using the join Spatial command to determine that each demographic block is within the functional radius of multiple uses. As a result of this step, a new layer was produced, in which, in addition to the population of each block and its distance to the nearest facilities, the number of selected options to access PHC facilities was also determined.
Fifth step: The r index was obtained by dividing the number of facilities columns into the block population column.
Sixth step: Finally, the access index value of each region to each of the PHC centers was obtained through the ratio of the r index of each region to its distance to the nearest facilities.
The average nearest neighbor distance was used to investigate the effective factors in the establishment of PHC facilities. The introduction of this method is presented below:
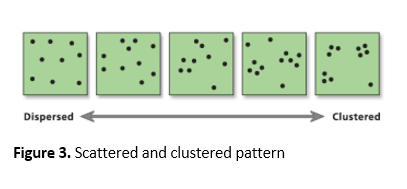
In this method, the nearest neighbor is calculated based on the average distance from each complication to its nearest neighbor’s complication. Then the average of all nearest neighbor distances is calculated. If the average distance is less than the average, the distribution of complications will be clustered and classified. But if the average distance is greater than the average, the complications have a scattered settlement pattern. This model is obtained through the ratio of the observed distance to the expected distance. The expected distance is the average distance between neighbors with a random distribution. If this index is less than one, it indicates a cluster pattern, but if it is more than one, the pattern will be scattered. Therefore, as a result of using this model, the studied complications and phenomena are divided in terms of settlement in a spectrum between cluster and scattered models. By cluster pattern we mean the complications follow each other in the form of a cluster and are located together. On the other hand, the scattered pattern indicates the opposite situation, that is, complications and phenomena are not related to each other in terms of the settlement )Figure 3(.
This research was approved by the ethics committee of Shahid Sadoughi University of Medical Sciences in Yazd based on the approval
of IR.SSU.SPH.REC.1400.010. Administrative permissions access to the databases for the study were required by the formal request from the Research & Technology Deputy of Shahid Sadoughi University of Medical Sciences.
.PNG)
Results
This study indicates that there is a concentration of PHC facilities in the historical and central regions of Yazd city. Diagram 1 illustrates the distribution of PHC facilities according to different urban regions.
The hot spot analysis map indicates that the historical region where the PHC facilities are
most concentrated is one of the cold spots with
low population density. )Figure 4(
Figure 5 indicates the location and density of PHC facilities. The findings indicate that the average direct distance of each comprehensive health center to the nearest similar center is 1131 meters and the average direct distance of each urban health post to the other nearest center is 1045 meters.
The functional range of PHC facilities in different urban regions is indicated in Figure 6. As can be seen, the highest amount on functional pressure of comprehensive healthcare centers is in the first, third and fourth regions of Yazd city, and the highest amount of functional pressure on urban health posts is in most parts of the first, second and third regions.
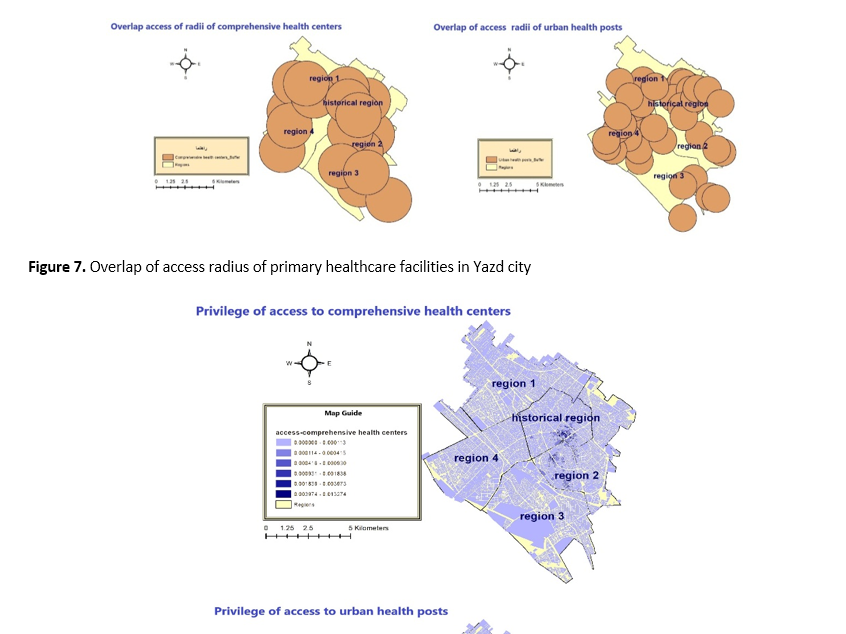
Figure 7 indicates that there is an overlap of access radius in comprehensive health centers in all regions of Yazd city. all points have similar conditions in terms of access radius, and these facilities cover all regions. Also, the highest overlap of urban health posts in Yazd city is observed in the first and fourth as well as the historical regions.
Diagram 2 indicates the distribution pattern of PHC facilities in Yazd city. As can be seen, the distribution pattern of comprehensive health centers is scattered. But the distribution pattern of urban health pots is random.
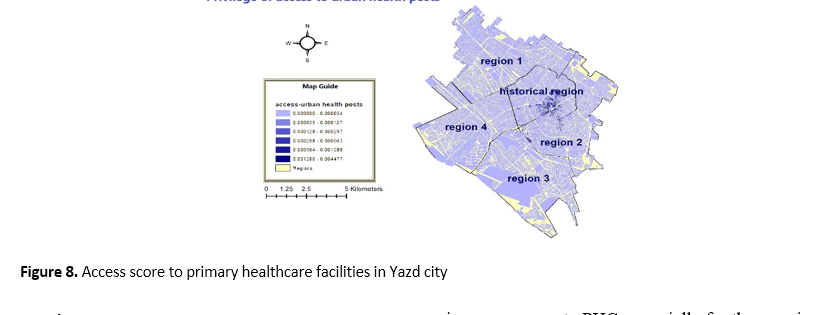
According to Figure 8, the highest level of access to comprehensive health centers is in the traditional and central regions of the city, and the lowest level of access is seen in other regions. Also, the highest level of access to urban health posts can be seen in the fourth regions as well as the historical region, and the lowest level of access is found in most of the areas in these regions.
Finally, according to the results of this model in different regions of Yazd city, it can be said that, except for the central and the traditional regions, the access score to the PHC facilities is extremely low in other regions, and other regions have no particular difference in terms of access to the PHC facilities.
Discussion
Our study analyzed the spatial accessibility to PHC facilities in Yazd city using GIS. The results indicate that there is unbalanced distribution and concentration of PHC facilities in the central and traditional regions of the city as well as unequal access to these facilities. Comprehensive health centers in Yazd city are located next to each other with a scattered distribution pattern and are 1131 meters away from each other on average. Also, the distance of urban health posts from each other is 1045 meters on average and are randomly located next to each other. The main concentration of the distribution of PHC facilities is observed in the central and traditional regions of the city, which according to the hot spots analysis, these regions are among the cold and low population density spots. Although the overlapping radius of access to basic healthcare facilities exists in almost all regions of the city, the access score of the regions indicates that the distribution of these facilities is not proportional to the population density, and the most functional pressure on comprehensive health centers and urban health posts is observed in the regions where there is the least access to these facilities. So, the results indicate unbalanced distribution and unfair access to PHC facilities in Yazd. One of the reasons for the excessive concentration of PHC facilities in the central and the traditional regions of the city is related to the specific topology of the city. During the past decades, most of the city's population density has formed in the traditional and central regions of the city, and therefore, to provide better services to the citizens, most of the public organizations, including PHC centers, have been located in the city center. Also, the settlement of doctors' offices and centers such as clinics and hospitals in the central regions of the city has led to the concentration of other services such as pharmacies, laboratories, physiotherapy centers, radiology centers and other medical services in this region of the city and has led to an unbalanced distribution of these services in the city (20). Currently, migration to the city has spread due to the industrialization of Yazd city, and also due to the spread of drought. All these, along with residential and commercial constructions and the expansion of higher education centers in the marginal areas of the city, have led to the rapid development of the city. At the same time, many people living in the central regions of the city also migrated to the new urban regions, away from the traffic and pollution of the city center, to have a better life and more peace in the new urban regions. This caused a decrease in the population density in the traditional and central region of the city and an increase in the population density in the new urban regions, but at the same time as the population growth rate in the marginal regions of the city, healthcare facilities did not grow rapidly. All this, along with the rapid growth of land prices in new urban regions, has led to the lack of balanced expansion of PHC facilities in the new urban regions and, as a result, reduced access of residents of these regions to PHC facilities compared to the central regions of the city. The results of this study are in line with many previous studies that have reported unbalanced and unequal distribution of healthcare facilities as well as a lack of proper access to these facilities (1, 2, 5, 14, 15, 18, 20-32).
Health policymakers and urban planners must increase the number of PHC facilities in regions with the highest population density and highest operational pressure, while simultaneously improving road infrastructure and public transportation to make healthcare more accessible to people in suburban regions. It is vital to use the capacity of the private sector and strengthen public participation to ensure that residents can access these facilities and services at a minimum distance. This in turn improves the delivery of quality healthcare services and hence ensures a healthier society.
One of the most important limitations of this study is that residents' preferences and socio-economic factors of citizens in access to healthcare facilities are not considered, and the results may have deviated from the residents' actual access to healthcare services.
.PNG)
Diagram 2. Distribution pattern of primary healthcare facilities in Yazd city
.PNG)
.PNG)
Conclusion
This study evaluated the spatial accessibility to PHC facilities in Yazd city using GIS. The results indicated that access to PHC facilities is different in distinctive regions of the city. However, access to these facilities is limited in many marginal regions.
This study can help health policymakers as well as urban planners to design effective measures to improve access to PHC, especially for the marginal regions of the city. Whereas Yazd acts as a small part of Iran that has an unbalanced distribution of PHC facilities, and the problems and solutions related to access and inequality in healthcare services in Yazd are probably similar to other regions of Iran, and other parts of the country can also adopt the approach used in this research.
This study has focused on the improvement of accessibility as a very important issue. In this regard, this study shows the need to improve the construction of healthcare facilities in Iran, which will reduce the effects of poverty and inequality and will help the improvement of accessibility and benefit. Also, this provides significant evidence to local health policymakers, enriches our knowledge of healthcare infrastructure, and provides a reference for policymakers and urban planners to take more effective measures using the geographic information system in the field of sustainable development of health infrastructures. We understand that access to healthcare is far beyond the availability of healthcare facilities and services; hence it is vital to establish social justice and social protection mechanisms toward universal health coverage to improve health and promote well-being.
Acknowledgements
This paper has been extracted from the MSc research thesis of Shahid Sadoughi University of Medical Sciences. We are grateful to all people who helped us to conduct this research.
Conflict of interests
The authors declared no conflict of interests.
Authors' contributions
Safi E, Amirfakhriyan M, Ameri H, and Ranjbar M design research; Safi E, Ranjbar M, and Zare H conducted research; Amirfakhriyan M, Ameri H, and Ranjbar M analyzed data; and Safi E wrote the first draft of the manuscript; Assefa Y, Zare H, Ameri H, and Ranjbar M reviewed and wrote sections of the manuscript; and Assefa Y, Ameri H, Ranjbar M, and Zare H critically revised the manuscript. All authors read and approved the final manuscript.
Funding
Non applicable.
Background: Primary healthcare facilities are essential to provide healthcare to individuals and the society closer to home. Fast, timely, and affordable access to these centers is important in each society. This is especially crucial to prevent and control the epidemics of non-communicable diseases that are highly affecting populations in urban settings. This study aimed to assess spatial accessibility to primary healthcare facilities in Yazd city (Iran), using a Geographic Information System (GIS).
Methods: In this descriptive-analytical study, which was conducted cross-sectionally in 2022, locational information related to primary healthcare centers, population distribution, and urban zoning of Yazd city were collected and recorded in Excel format. Then, distribution maps of each of the studied uses were determined. Then, the existing indicators and standards regarding the uses were determined through documentary studies, and a geographic database was formed through the GIS software collection. Data were analyzed using indicators and models such as hot spot analysis, Thiessens polygons algorithm, access model based on the two-step floating catchment area, and the average distance model of the nearest neighbor.
Results: The results indicated that the comprehensive health centers in Yazd city are located next to each other with a scattered distribution pattern, and are away from each other by an average distance of 1131 meters. Also, the distance of urban health posts from each other is 1045 meters on average, and are randomly located next to each other. The main concentration of the distribution of primary health care facilities is observed in the central and traditional regions of the city, which, according to the hot spot analysis, are among the cold and low population density spots. In addition, the access score of the regions indicates that the distribution of these facilities is not according to the population density, and the highest functional pressure of comprehensive health centers as well as urban health posts is observed in the regions where there is the least access to these facilities.
Conclusion: There is a disparity between the distribution of primary healthcare facilities and population density in Yazd city, Iran. This study provides significant evidence to local health policymakers and urban planners to design more efficient actions related to equal development of health infrastructure by using the GIS.
Key words: Spatial accessibility, Primary health care, GIS, Equity
Introduction
Primary Health Care (PHC) is known as an important facilitator of overall population health )1(; and poor access to this care can affect people's lives and survival )2(. The optimal allocation of health resources is achieved to match the provision of healthcare with social and economic needs through improving access to PHC services, reducing waiting time, meeting the health and treatment needs of the population, and increasing the overall quality of life )3(. It is also very important for the provision and distribution of healthcare and the general objective of universal health coverage )4(.
In addition, sufficient access to PHC is one of the vital elements for having an advanced society )5(. The World Health Organization (WHO), under the concept of human rights, defines access to healthcare as physical, safe, and reasonable availability for all people, especially the vulnerable and marginalized groups, ethnic minorities and indigenous people, women, children, elderly groups and people with disabilities )5(. The level of access to healthcare services depends on many factors including the unique topography of each city, its spatial pattern, and planning or lack of planning. This makes the level of access to healthcare services is variable across cities )6(.
Four dimensions of accessibility have been identified, including (a) availability, (b) geographical dimension that is related to the physical location, (c) acceptability and (d) affordability. The first two dimensions of
access are related to geographic or spatial accessibility )7(. Healthcare access problems include assessing the adequacy of the number of healthcare facilities and the appropriate distribution of these facilities to ensure easy and immediate access to a healthcare center for every patient who needs it, affordability, and therefore access to quality healthcare for all patients )4, 8(.
Since the 1980s, the use of spatial accessibility to healthcare services has become prominent. Healthcare access can be defined as the capacity of a person or population to enter the health system, which has spatial, organizational, and financial dimensions )9(. Spatial dimensions of access such as healthcare capacity (e.g., quality and quantity of medical equipment, doctors, or patient beds), patient socioeconomic aspects (e.g., status, income, age, and gender), and population demand )7(.
Spatial accessibility is defined as the location of healthcare facilities regarding the location of the people who need them. It also refers to the relative ease with which people can access healthcare facilities from a given location. The distance a person must travel to get to healthcare facilities is a key factor that should be considered when measuring spatial accessibility )7, 10(.
Geospatial techniques are widely used in various fields of health service studies to maximize geographic access to healthcare services. Analysis of access to healthcare based on GIS is a logical method that can be used to evaluate the level of equitable access )11, 12(.
At the global level, since GIS has analytical capabilities and dynamic image display, it is considered a widely used technology in health system planning )13-15(. GIS is designed for storing, managing, and displaying spatial data and helping the analysis and interpretation of these data )16(. These systems have important tools that can help the planning of healthcare services and decision-making processes. These tools include database management, planning, risk assessment, service area mapping, location identification and access tools )4(.
Since one of the criteria of sustainable urban development and social justice is to pay attention to the balanced distribution of urban services and facilities, the distribution of services in the city should therefore be in a way that establishes the best relationship with the discussion of social justice. Planners try to optimize the distribution of service centers in cities, and this distribution is proportional to the distribution of the population and the amount of demand in various parts of the city )17(.
Previous studies have proven that spatial barriers between people and healthcare facilities reduce access to healthcare and the use of preventive services )1, 2, 8, 12, 15, 18(. The rational distribution of healthcare facilities ensures equal access to the public to benefit from essential services, thereby eliminating spatial polarization and reducing spatial differentiation, which is significant for urban development )2(. The existence of available healthcare facilities is vital for service quality and public satisfaction. Therefore, it is important to examine the distribution and availability of PHC facilities in cities and consider the importance and necessity of equal access of people to healthcare services, in creating a healthy population, which is one of the signs of countries development, this study aimed to assess spatial accessibility to PHC facilities in Yazd city (Iran), using GIS.
Materials and Methods
In this descriptive-analytical study, which was conducted in 2022, all PHC facilities in Yazd city were studied. Yazd city is the second "crude clay" and "historic" city in the world, which is the capital of Yazd province in the center of Iran. The population of Yazd city was 557,634 people in 2020. Yazd city has 5 municipal regions, which are shown on the map below (Figure 1).
Primary healthcare services in Yazd city is provided through fifty-nine centers (19 comprehensive health center and 40 urban health post). To collect the required data, the information related to the addresses of all the mentioned users was obtained from the health deputy of the Yazd University of Medical Sciences and Yazd Municipality and recorded in an Excel form. Then, using the available information, the distribution maps of each of the PHC centers were determined. Afterward, through documentary studies, the existing indicators and standards regarding the uses were determined, and then the geographic database was formed through the GIS software collection. Then, the data were analyzed using indicators and models such as hot spot analysis, Thiessen's polygons algorithm, access model based on the Two-step floating catchment area, and the average distance model of the nearest neighbor.
- Spatial accessibility to health care facilities
A) Euclidean distance (Distance Eqladian) (19)
It represents the direct distance between two points without considering complications. In other
words, this distance considers the distance between two complications without considering the communication network, which is also called direct distance or spatial or aerial distance
(Figure 2).
B) Thiessen's polygons algorithm (19)
From among the important criteria for measuring access, we can refer to the number of user population for each healthcare facility. That is, how much is the per capita population for each healthcare facility. Using Thiessens polygons algoritm (irregular polygonal surfaces), first, the functional radius of each healthcare use was obtained separately, and then the population located in each polygon was calculated. Finally, while using the population statistics of each region and determining the proportion of each use, the calculated values of the population using healthcare uses were normalized.
C) Model accessibility (19)
In previous studies, various methods have been used to analyze spatial accessibility. These methods can be classified into three categories:
a) Access based on the distance between the population and the facilities
b) Access based on the service radius of the facility and the population covered by each service
c) Access based on the number of facilities available to people
In each stage, different methods and models have been proposed by researchers to calculate the amount of access. But each of these methods has advantages and disadvantages. Their main disadvantage is that access is a combination of various methods, whereas the mentioned methods have only paid attention to one aspect of it, they therefore, lack comprehensiveness. For this reason, models based on the "Two-step floating catchment area" model (Wang & Luo, 2005) have been presented, in which spatial accessibility to services is considered as a function of the following factors:
- The number of populations using the facility: if the number is more, there is less opportunity for the population to use the facility and vice versa.
- The distance from the facilities: the smaller the distance between the users and the source of the facility, the easier and better it will be for people to access services.
- Selection options: If people have more selection options regarding the use of facilities, they will certainly have better access.
In this study, according to the type of variables and values available for each of them, a method called ACCESS was used, which is based on ARC GIS software. For this purpose, the functional radius and privacy of each of the PHC facilities in Yazd city were determined on the network. This value was determined based on existing standards. Then, it was measured whether the population area is located within the boundaries of multiple PHC facilities or in other words, it has appropriate access to several PHC facilities. After that, the distance of each population area to the nearest PHC facilities around it was calculated and using the following relationship, the access score of each population area to each of the PHC facilities was obtained:
ri: Is also obtained from the following relation:
di: The average network distance between the population of each range and the facility options that can be selected for it:
ni: Number of facilities use choices for the population of each range
pi: Number of populations in each range
To calculate this index, the required information was stored in two separate layers with the names of the healthcare uses layer by their type and the population blocks layer in the geographic information system database, and the access scores were conducted for each of the demographic blocks within the framework of six steps as the followings:
First step: Considering the existing standards about the distance of each person to PHC facilities according to their type. For this reason, many sources and previous studies were used.
Second step: At this step, the nearest facility for each demographic block and its distance were determined. In other words, at this step, it was determined which facilities the demographic block is close to and how far they are from it. The layer resulting from this process was named the "distance to facilities" layer.
Third step: The demographic information related to each block was linked to the "distance to facilities" layer using the “JOIN” command. The result of this process was the creation of a new layer in which the distance to the nearest facilities and the population of each block was determined.
Fourth step: The layer created in the third step was linked to the functional radius layer of PHC facilities (the result of the first step) using the join Spatial command to determine that each demographic block is within the functional radius of multiple uses. As a result of this step, a new layer was produced, in which, in addition to the population of each block and its distance to the nearest facilities, the number of selected options to access PHC facilities was also determined.
Fifth step: The r index was obtained by dividing the number of facilities columns into the block population column.
Sixth step: Finally, the access index value of each region to each of the PHC centers was obtained through the ratio of the r index of each region to its distance to the nearest facilities.
- Non-spatial accessibility to health care facilities:
The average nearest neighbor distance was used to investigate the effective factors in the establishment of PHC facilities. The introduction of this method is presented below:
In this method, the nearest neighbor is calculated based on the average distance from each complication to its nearest neighbor’s complication. Then the average of all nearest neighbor distances is calculated. If the average distance is less than the average, the distribution of complications will be clustered and classified. But if the average distance is greater than the average, the complications have a scattered settlement pattern. This model is obtained through the ratio of the observed distance to the expected distance. The expected distance is the average distance between neighbors with a random distribution. If this index is less than one, it indicates a cluster pattern, but if it is more than one, the pattern will be scattered. Therefore, as a result of using this model, the studied complications and phenomena are divided in terms of settlement in a spectrum between cluster and scattered models. By cluster pattern we mean the complications follow each other in the form of a cluster and are located together. On the other hand, the scattered pattern indicates the opposite situation, that is, complications and phenomena are not related to each other in terms of the settlement )Figure 3(.
This research was approved by the ethics committee of Shahid Sadoughi University of Medical Sciences in Yazd based on the approval
of IR.SSU.SPH.REC.1400.010. Administrative permissions access to the databases for the study were required by the formal request from the Research & Technology Deputy of Shahid Sadoughi University of Medical Sciences.
Results
This study indicates that there is a concentration of PHC facilities in the historical and central regions of Yazd city. Diagram 1 illustrates the distribution of PHC facilities according to different urban regions.
The hot spot analysis map indicates that the historical region where the PHC facilities are
most concentrated is one of the cold spots with
low population density. )Figure 4(
Figure 5 indicates the location and density of PHC facilities. The findings indicate that the average direct distance of each comprehensive health center to the nearest similar center is 1131 meters and the average direct distance of each urban health post to the other nearest center is 1045 meters.
The functional range of PHC facilities in different urban regions is indicated in Figure 6. As can be seen, the highest amount on functional pressure of comprehensive healthcare centers is in the first, third and fourth regions of Yazd city, and the highest amount of functional pressure on urban health posts is in most parts of the first, second and third regions.
Figure 7 indicates that there is an overlap of access radius in comprehensive health centers in all regions of Yazd city. all points have similar conditions in terms of access radius, and these facilities cover all regions. Also, the highest overlap of urban health posts in Yazd city is observed in the first and fourth as well as the historical regions.
Diagram 2 indicates the distribution pattern of PHC facilities in Yazd city. As can be seen, the distribution pattern of comprehensive health centers is scattered. But the distribution pattern of urban health pots is random.
According to Figure 8, the highest level of access to comprehensive health centers is in the traditional and central regions of the city, and the lowest level of access is seen in other regions. Also, the highest level of access to urban health posts can be seen in the fourth regions as well as the historical region, and the lowest level of access is found in most of the areas in these regions.
Finally, according to the results of this model in different regions of Yazd city, it can be said that, except for the central and the traditional regions, the access score to the PHC facilities is extremely low in other regions, and other regions have no particular difference in terms of access to the PHC facilities.
Discussion
Our study analyzed the spatial accessibility to PHC facilities in Yazd city using GIS. The results indicate that there is unbalanced distribution and concentration of PHC facilities in the central and traditional regions of the city as well as unequal access to these facilities. Comprehensive health centers in Yazd city are located next to each other with a scattered distribution pattern and are 1131 meters away from each other on average. Also, the distance of urban health posts from each other is 1045 meters on average and are randomly located next to each other. The main concentration of the distribution of PHC facilities is observed in the central and traditional regions of the city, which according to the hot spots analysis, these regions are among the cold and low population density spots. Although the overlapping radius of access to basic healthcare facilities exists in almost all regions of the city, the access score of the regions indicates that the distribution of these facilities is not proportional to the population density, and the most functional pressure on comprehensive health centers and urban health posts is observed in the regions where there is the least access to these facilities. So, the results indicate unbalanced distribution and unfair access to PHC facilities in Yazd. One of the reasons for the excessive concentration of PHC facilities in the central and the traditional regions of the city is related to the specific topology of the city. During the past decades, most of the city's population density has formed in the traditional and central regions of the city, and therefore, to provide better services to the citizens, most of the public organizations, including PHC centers, have been located in the city center. Also, the settlement of doctors' offices and centers such as clinics and hospitals in the central regions of the city has led to the concentration of other services such as pharmacies, laboratories, physiotherapy centers, radiology centers and other medical services in this region of the city and has led to an unbalanced distribution of these services in the city (20). Currently, migration to the city has spread due to the industrialization of Yazd city, and also due to the spread of drought. All these, along with residential and commercial constructions and the expansion of higher education centers in the marginal areas of the city, have led to the rapid development of the city. At the same time, many people living in the central regions of the city also migrated to the new urban regions, away from the traffic and pollution of the city center, to have a better life and more peace in the new urban regions. This caused a decrease in the population density in the traditional and central region of the city and an increase in the population density in the new urban regions, but at the same time as the population growth rate in the marginal regions of the city, healthcare facilities did not grow rapidly. All this, along with the rapid growth of land prices in new urban regions, has led to the lack of balanced expansion of PHC facilities in the new urban regions and, as a result, reduced access of residents of these regions to PHC facilities compared to the central regions of the city. The results of this study are in line with many previous studies that have reported unbalanced and unequal distribution of healthcare facilities as well as a lack of proper access to these facilities (1, 2, 5, 14, 15, 18, 20-32).
Health policymakers and urban planners must increase the number of PHC facilities in regions with the highest population density and highest operational pressure, while simultaneously improving road infrastructure and public transportation to make healthcare more accessible to people in suburban regions. It is vital to use the capacity of the private sector and strengthen public participation to ensure that residents can access these facilities and services at a minimum distance. This in turn improves the delivery of quality healthcare services and hence ensures a healthier society.
One of the most important limitations of this study is that residents' preferences and socio-economic factors of citizens in access to healthcare facilities are not considered, and the results may have deviated from the residents' actual access to healthcare services.
Diagram 2. Distribution pattern of primary healthcare facilities in Yazd city
Conclusion
This study evaluated the spatial accessibility to PHC facilities in Yazd city using GIS. The results indicated that access to PHC facilities is different in distinctive regions of the city. However, access to these facilities is limited in many marginal regions.
This study can help health policymakers as well as urban planners to design effective measures to improve access to PHC, especially for the marginal regions of the city. Whereas Yazd acts as a small part of Iran that has an unbalanced distribution of PHC facilities, and the problems and solutions related to access and inequality in healthcare services in Yazd are probably similar to other regions of Iran, and other parts of the country can also adopt the approach used in this research.
This study has focused on the improvement of accessibility as a very important issue. In this regard, this study shows the need to improve the construction of healthcare facilities in Iran, which will reduce the effects of poverty and inequality and will help the improvement of accessibility and benefit. Also, this provides significant evidence to local health policymakers, enriches our knowledge of healthcare infrastructure, and provides a reference for policymakers and urban planners to take more effective measures using the geographic information system in the field of sustainable development of health infrastructures. We understand that access to healthcare is far beyond the availability of healthcare facilities and services; hence it is vital to establish social justice and social protection mechanisms toward universal health coverage to improve health and promote well-being.
Acknowledgements
This paper has been extracted from the MSc research thesis of Shahid Sadoughi University of Medical Sciences. We are grateful to all people who helped us to conduct this research.
Conflict of interests
The authors declared no conflict of interests.
Authors' contributions
Safi E, Amirfakhriyan M, Ameri H, and Ranjbar M design research; Safi E, Ranjbar M, and Zare H conducted research; Amirfakhriyan M, Ameri H, and Ranjbar M analyzed data; and Safi E wrote the first draft of the manuscript; Assefa Y, Zare H, Ameri H, and Ranjbar M reviewed and wrote sections of the manuscript; and Assefa Y, Ameri H, Ranjbar M, and Zare H critically revised the manuscript. All authors read and approved the final manuscript.
Funding
Non applicable.
Type of Study: Original article |
Subject:
Healt care Management
Received: 2023/03/4 | Accepted: 2023/03/28 | Published: 2023/03/30
Received: 2023/03/4 | Accepted: 2023/03/28 | Published: 2023/03/30
References
1. Guagliardo MF. Spatial accessibility of primary care: concepts, methods and challenges. International Journal of Health Geographics. 2004; 3(3): 1-13.
2. Cheng M, Tao L, Lian Y, Huang W. Measuring spatial accessibility of urban medical facilities: A case study in changning district of Shanghai in China. International Journal of Environmental Research and Public Health. 2021; 18(18): 9598. [DOI: 10.3390/ ijerph18189598]
3. Baazeem M, Tennant M, Kruger E. Determining variations in access to public hospitals in Makkah, a gis-based approach. Saudi Journal of Health Systems Research. 2021; 1: 26–32. [DOI: 10.1159/ 000513632]
4. Parvin F, Ali SA, Hashmi SNI, Khatoon A. Accessibility and site suitability for healthcare services using GIS-based hybrid decision-making approach: A study in Murshidabad, India. Spatial Information Research. 2021; 29(1): 1-18. [DOI: 10.1007/s41324-020-00330-0]
5. Abubakar A, Mohammed M.S, Ibrahim W.M. GIS analysis in lokating of health facilities in the rural community of IGABI local government area of KADUNA state. Journal of Conflict Resolution and Social Issues. 2021; 2(1): 109-24.
6. Çakır C, Işınkaralar Ö, Öztürk S. Geographical accessibility of health care network via GIS in Kastamonu. Journal of Engineering and Science. 2022; 8(1): 60-8. [DOI: 10.55385/kastamonujes.1099909]
7. Zafri NM, Nurullah M, Neema MN, Waliullah M. Spatial accessibility to healthcare facilities in coastal region of Bangladesh. The International Journal of Health Planning and Management. 2021; 36(3): 643-55. [DOI: 10.1002/hpm.3107]
8. Luqman M, Khan SU. Geospatial application to assess the accessibility to the health facilities in Egypt. The Egyptian Journal of Remote Sensing and Space Sciences. 2021; 24(3): 699-705. [DOI: 10.1016/ j.ejrs.2021.02.005]
9. Aziz A, JLi J, Hu Sh, Hu R. Spatial accessibility of township to county hospital and its disparity among age and urbanizing groups in Anhui, China-a GIS analysis. Computational Urban Science. 2022; 2(9). [DOI: 10.1007/s43762-022-00037-y]
10. Song G, He X, Kong Y, Li K, Song H, Zhai Sh, et al. Improving the spatial accessibility of community-level healthcare service toward the ‘15-Minute City’ goal in China. ISPRS International Journal of Geo-Information. 2022; 11(8): 436. [DOI: 10. 3390/ijgi11080436]
11. Katta S, Srinagesh B. GIS-Based healthcare accessibility analysis—a case study of selected municipalities of hyderabad. Livelihood Enhancement Through Agriculture, Tourism and Health: Springer; 2022. p. 389-406.
12. Bihin J, Longueville FD, Linard C. Spatial accessibility to health facilities in Sub-Saharan Africa: Comparing existing models with survey-based perceived accessibility. International Journal of Health Geographics. 2022; 21(18): 1-12. [DOI: 10.1186/s12942-022-00318-z]
13. Robin TA, Khan MA, Kabir N, Rahaman ST, Karim A, Mannan, II, et al. Using spatial analysis and GIS to improve planning and resource allocation in a rural district of Bangladesh. BMJ Global Health. 2019; 4(Suppl 5): e000832. [DOI: 10.1136/bmjgh-2018-000832]
14. Liu Sh, Qin Y, Xu Y. Inequality and influencing factors of spatial accessibility of medical facilities in rural areas of China: A case study of Henan province. International Journal of Environmental Research and Public Health. 2019; 16(10): 1833. [DOI: 10. 3390/ijerph16101833]
15. Lawal O, Anyiam FE. Modelling geographic accessibility to primary health care facilities: Combining open data and geospatial analysis. Geo-spatial Information Science. 2019; 22(3): 174-84. [DOI: 10.1080/10095020.2019.1645508]
16. Boyda DC, Holzman SB, Berman A, Grabowski MK, Chang LW. Geographic information systems, spatial analysis, and HIV in Africa: A scoping review. PloS ONE. 2019; 14(5): e0216388. [DOI: 10.1371/journal.pone.0216388]
17. Azadkhani P, Mehrabi Mehrabi K. Analyzing the spatial distribution of specialist physician offices in Ilam city and determining suitable zones to propose a desirable pattern. Journal of Research and Urban Planning. 2022; 12 (47): 77-94. [In Persian] [DOI: 10.30495/jupm.2022.4065]
18. Murad A. Using GIS for determining variations in health access in Jeddah city, Saudi Arabia. ISPRS International Journal of Geo-Information. 2018; 7(7): 254. [DOI: 10.3390/ ijgi7070254]
19. Rahnama MR, Amirfakhtian M. Analysis of spatial access to healthcare services in Mashhad city. Journal of Physical-Spatial Plan. 2013; 1(3): 61-74. [In Persian]
20. Zangiabadi A, Hekmatnia H, Yavari H. Locating health care centers in Yazd using GIS [MSc thesis]. Yazd: Ministry of Science, Research and Technology - Payam Noor University - Payam Noor University of Yazd Province - Faculty of Social and Economic Sciences; 2010. [In Persian]
21. Hajinejad A, Tuolabinejad M, Sadeghi Kh. Optimal location rural health centers (case study: Roshtkhar district, Khorasan Razavi Province ). Journal of Studies of Human Settlements Planning. 2020; 15(2): 409- 30. [In Persian]
22. Varesi HR, Sharifi N, Shahsavani MJ. Locating sanitary- therapeutic centers using Geographic Information System (GIS) and Analytical Hierarchy Process (AHP) (case study: Najaf Abad city). Health Information Management. 2015; 11(7): 864. [In Persian] [DOI: 10.22059/ jhgr.2020. 104886. 1006794]
23. Allahyari A, Tabatabai Jebeli FS. Optimum location of urban medical centers using GIS: A case study of Morvdasht city. International Conference on civil engineering, architecture and urban planning of contemporary Iran: 2016. [In Persian]
24. Ebrahimzadeh I, Zareie SH. An analysis on the optimal location of healthcare centers using geographic information system (case study: Firouzabad city). Journal of Geography. 2012; 10(35): 83-104. [In Persian]
25. Nasiripour AA, Raeissi P, Asgari A. Analysis of the spatial distribution of health care centers of Shahrekord by geographical information system. Journal of Shahrekord University of Medical Sciences. 2015; 16(6): 19-27. [In Persian]
26. Reshadat S, Saedi Sh, Zangeneh A, Amooie MR, Karbasi A. Equity in access to health care using geographic information system: A Kermanshah case study. Journal of Mazandaran University of Medical Sciences. 2014; 24(115): 134-40. [In Persian]
27. Poursheykhian A, Amar T, Ebrahimi SA. Analysis of the location criteria of Bandar Anzali health centers. Geographical perspective. 2012; 7(21): 88-100. [In Persian]
28. Gharenejad H. Investigating the geographical distribution of healthcare centers in Isfahan city. Geographical Research. 1997; 12(1). [In Persian]
29. Ngowi KA, William CMP. Analysis of geographical accessibility to healthcare facilities using geospatial techniques: The case of peri-urban dwellers in Mbeya City. Journal of the Geographical Association of Tanzania. 2020; 40(1): 137-55. [DOI: 10.56279/jgat.v40i1.23]
30. Jin M, Liu L, Tong D, Gong Y, Liu Y. Evaluating the spatial accessibility and distribution balance of multi-level medical service facilities. International Journal of Environmental Research and Public Health. 2019; 16(7): 1150. [DOI: 10. 3390/ ijerph16071150]
31. Dutta B, Das M, Roy U, Das S, Rath S. Spatial analysis and modelling for primary healthcare site selection in Midnapore town, West Bengal. GeoJournal. 2022; 87: 4807–36. [DOI: 10.1007/ s10708-021-10528-w]
32. Salvacion AR. Measuring spatial accessibility of healthcare facilities in Marinduque, Philippines. ISPRS International Journal of Geo-Information. 2022; 11(10): 516. [DOI: 10.3390/ ijgi11100516]
Send email to the article author
| Rights and permissions | |
 |
This work is licensed under a Creative Commons Attribution-NonCommercial 4.0 International License. |
