

Volume 9, Issue 3 (10-2025)
EBHPME 2025, 9(3): 173-189 |
Back to browse issues page


Download citation:
BibTeX | RIS | EndNote | Medlars | ProCite | Reference Manager | RefWorks
Send citation to:


BibTeX | RIS | EndNote | Medlars | ProCite | Reference Manager | RefWorks
Send citation to:
Otrodi F, Khademi Zare H, Zare Mehrjerdi Y, Fakhrzad M B. Addressing Imbalances from Fixed Pricing, Subsidies, and Misused Discounts in Pharmaceutical Chains through Coordination. EBHPME 2025; 9 (3) :173-189
URL: http://jebhpme.ssu.ac.ir/article-1-547-en.html
URL: http://jebhpme.ssu.ac.ir/article-1-547-en.html


Department of Industrial Engineering, Yazd University, Yazd, Iran , hkhademiz@yazd.ac.ir
Keywords: Pharmaceutical Industry, Marketing, Health Policy, Healthcare Economics and Organizations, Health Services Accessibility
Full-Text [PDF 1584 kb]
(33 Downloads)
| Abstract (HTML) (414 Views)
* R= Random, P= Price, Fr=Freshness, Se= Sales, Or= Organic level, N=Normal distribution, C= Constant, St= Stock dependent, Ad= Advertisement sensitive demand, λs j λ
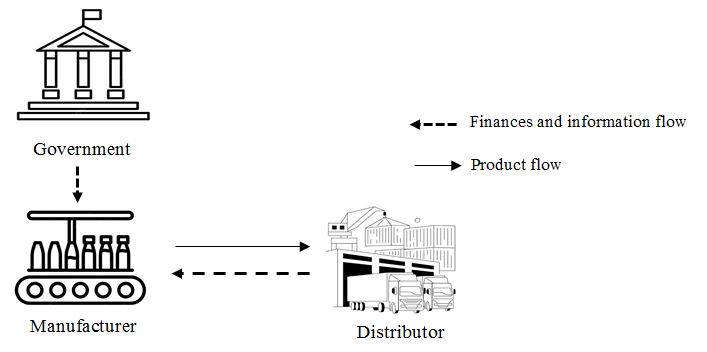
Figure 1. A view of the members of the drug supply chain under investigation along with their
relationship with the government
Pharmaceutical market
whereα β 1 η j
whereφ >0 τ >0
Coordinated supply chain – quantity discount
Quantity discount is a common policy in which the manufacturer (leader) encourages the distributor (follower) to order beyond its economic order quantity (EOQ) by offering a wholesale price discount for additional savings and compensating any potential profit loss.
Order Quantity
The distributor’s inventory at time 0 isI 0 = Q
Full derivations of the distributor’s objective function and optimal conditions under this policy are available upon request.
Distributor objective function
The distributor's objective function accounts for holding cost, revenue from sales, purchasing costs, ordering cost. A full mathematical exposition is available upon request. We have
(4)
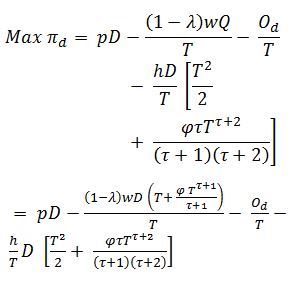
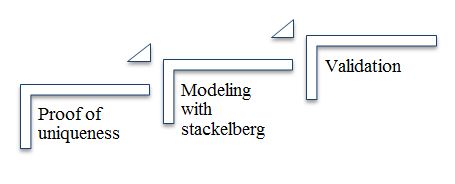
Figure 2. Steps of the solution methodology
Funding
This research was conducted as part of a PhD dissertation at Yazd University and received no external funding.
Full-Text: (13 Views)
| A B S T R A C T Introduction: In regulated markets such as Iran, Canada, and Japan, fixed pricing policies, government subsidies, and misused discount practices contributed to financial instability and persistent medicine shortages. These regulatory constraints limited pricing flexibility, creating misaligned incentives among manufacturers, distributors, and retailers, which fueled competition and disrupted equitable access to essential drugs. The reliance on poorly designed discounts further complicated supply chain dynamics, leading to inefficiencies and reduced availability. Materials and Methods: This study developed a practical decision-support framework, tailored to the Iranian context where perishability and financial challenges were prominent to address these issues. The framework optimized discount strategies to align with existing subsidy structures, fostering better coordination across supply chain actors. Various operational scenarios were evaluated using a mathematical model incorporating perishability dynamics and sensitivity analysis to assess impacts on supply chain performance. Results: The findings revealed that, unlike the common practice of using discounts solely to boost sales while neglecting other supply chain members, potentially leading to their bankruptcy, this study’s coordinated approach enhanced overall supply chain profitability. This strategy balanced incentives across actors, mitigating financial strain and improving drug availability, particularly in underserved regions. Conclusion: This study offered policymakers insights to refine subsidy allocation and enhance equitable healthcare access through infrastructure support. For managers, it provided actionable tools to boost supply chain resilience via coordinated discount practices and demand alignment. The approach tackled immediate challenges and laid a foundation for sustainable healthcare systems, advancing knowledge by integrating coordination into subsidized supply chain models. Keywords: Pharmaceutical Industry, Marketing, Health Policy, Healthcare Economics and Organizations, Health Services Accessibility |
Introduction
The pharmaceutical supply chain is a cornerstone for ensuring equitable access to medicines worldwide, connecting production, distribution, and delivery to meet patient demands (1, 2). In regulated markets like Iran, Canada, Japan, and France, government policies such as fixed pricing and subsidies are implemented to promote affordability and social equity (3, 4). These interventions, while beneficial in theory, often remove price competition, forcing manufacturers and distributors to rely on strategies like trade credit and quantity discounts to gain market share. This shift, however, frequently results in financial instability, bankruptcies, and drug shortages, challenging the goal of accessible healthcare (2, 5).
Government subsidies, such as Iran’s 30% cost reduction on imported active pharmaceutical ingredients (APIs), play a vital role in supporting affordable generic drugs and enhancing supply chain resilience (6, 7). Yet, their fixed nature, dictated by regulatory authorities and beyond the control of supply chain actors, creates coordination challenges (8). Unlike Canada’s insurance system or Japan’s centralized pricing, Iran’s subsidy reliance due to sanctions shapes its challenges, though this study focuses on fixed pricing, with comparative analysis deferred to future work (9-11). The added complexity of perishability, where improper storage leads to spoilage and increased costs, further aggravates shortages, threatening patient access (12). This highlights a critical gap, as existing studies on perishable inventory management fail to address the combined impact of fixed pricing, subsidies, and discount misuse.
The persistent financial imbalances in these markets underscore the need for effective strategies to stabilize pharmaceutical supply chains. Misaligned incentives, particularly from misused quantity discounts driven by profit motives under fixed pricing, interrupt cash flows and exacerbate instability (13). In Iran, where these issues are pronounced due to regulatory constraints, there is an urgent demand for practical solutions that can align supply chain operations with existing policies, offering a pathway to mitigate these challenges (7).
This study examined how a two-stage pharmaceutical supply chain (involving manufacturers and distributors) worked in regulated markets like Iran, Canada, and Japan. Fixed pricing and government subsidies for active pharmaceutical ingredients (APIs) helped improve access to generic drugs in the past. However, strong competition and poor money flow management threatened the stability of the supply chain and continuous drug availability. This research tackled financial problems in these subsidized, fixed-price systems, showing that better coordination effectively solved these issues by adjusting discount and subsidy levels. Using a team-based approach, this study enhanced supply chain teamwork through quantity discounts, introducing the following new ideas:
- Managing perishable drugs: Developed a straightforward plan using a parametric model, specifically the Weibull method, to handle inventory of perishable drugs (like those needing cold storage) in fixed-price systems. This approach, aligned with pharmaceutical cold chain standards, reduced waste and ensured a steady supply. Since drugs are perishable goods, this study’s parametric model focused on coordinating efforts between manufacturers and distributors to prevent spoilage and maintain availability. Table (1) compares past studies that addressed perishable goods or medicines with parametric models and supply chain coordination, highlighting how our model stands out.
- Enhanced chain coordination: This study tested agreements on quantity discounts in fixed-price drug supply chains to reduce overall costs and ensure a steady, sustainable supply of medicines for patients. It focused on helping manufacturers and distributors work together smoothly to keep drug availability strong.
- Novel demand prediction: Developed a practical way to predict medicine demand by observing how sales teams and managers set discounts based on competitors’ actions. This approach, unlike older, simpler methods, helped forecast the need for generic drugs more accurately, benefiting patient access. Table (1) compares past studies on this topic.
- Subsidies in fixed pricing: This study pioneered a practical approach to include government subsidies, such as reducing costs for imported drug ingredients, to improve teamwork between drug makers and suppliers in regulated markets like Iran. Until now, parametric models had not explored how subsidies affect the drug supply chain, but this method showed how they can help coordinate efforts and ensure a steady medicine supply. Table (1) compares past studies on this topic.
- Managing financial flow: Focused on handling money movement rather than just moving goods to keep the drug supply chain steady, ease financial difficulties, and make sure patients in regulated areas had fair access to drugs.
-
Testing different scenarios: Compared the study’s proposed model, which used discount tools to improve coordination, with two approaches: a centralized setup, seen as an ideal but impractical system with one leader, and a decentralized setup, reflecting the current situation where each member acted as a leader, leading to financial struggles and even bankruptcy. This comparison showed how this discount strategy boosted overall supply chain profit and offered clear guidance for policymakers to maintain ongoing drug availability for patients.
Table 1. Selective literature review on coordination mechanisms for perishable goods supply chains *
| Fixed pricing |
Subsidy | Type of deterioration |
Type of demand |
Coordination mechanism | Reference |
| (-) | (-) | FL | D(P) | Quantity discount | (14) |
| (-) | (-) | FL | R | Quantity flexibility + buy-back | (15) |
| (-) | (-) | TD | D(Se, Or, P) | Cost and revenue sharing | (16) |
| (-) | (-) | TD | D(P, Fr) | Cost sharing | (17) |
| (-) | (-) | TD | D(P, Fr) | Revenue sharing | (18) |
| (-) | (-) | FL | Uncertain | Revenue sharing | (19) |
| (-) | (-) | TD | D(P, Fr) | Two-part tariffs | (20) |
| (-) | (-) | FL | D(U|U) | Risk sharing | (21) |
| (-) | (-) | FL | N | Revenue sharing+ quantity discount | (22) |
| (-) | (-) | FL | D(P) | Quantity discount+ target rebate | (23) |
| (-) | (-) | FL | C | Quantity discount | (24) |
| (-) | (-) | TD | D(P) | Partial trade credit | (25) |
| (-) | (-) | FL | N | Option +quantity discount | (26) |
| (-) | (-) | TD | D(St) | Quantity discount | (27) |
| (-) | (-) | FL | D(Ad) | Quantity discount | (28) |
| (-) | (-) | FL | C | Quantity discount | (29) |
| (-) | (-) | FL | C | Quantity discount | (30) |
| (-) | (-) | TD | D(P) | Quantity discount | (31) |
| (-) | (-) | TD | D(P, Fr) | Wholesale-market clearance+ wholesale-price-discount Sharing | (32) |
| (+) | (+) | Weibull | D( |
quantity discount | This Paper |
Table (1) summarizes 19 representative studies on perishable goods and supply chain coordination mechanisms. Most prior research has focused on traditional contracts such as quantity discounts, revenue-sharing, cost-sharing, buy-back, and two-part tariff schemes (e.g.,(14(- )32)). However, these studies generally neglect the joint consideration of fixed pricing policies and government subsidies, which are particularly relevant in regulated pharmaceutical markets such as Iran.
From a modeling perspective, earlier works predominantly adopt simplified deterioration structures, including fixed lifetime or time-dependent deterioration, along with basic demand functions such as constant, normal, or price- and freshness-sensitive demand. In contrast, the proposed model employs a Weibull distribution to capture drug deterioration more accurately in compliance with cold-chain requirements. Furthermore, the demand function incorporates both quantity discounts and competitors’ discount strategies, enabling a more realistic representation of market competition. These features distinguish the present study from existing literature and enhance its applicability to real pharmaceutical.
Practically, previous studies neglected financial instability and equitable access in subsidized systems, often assuming ideal conditions (e.g.,(19(, (21)) or ignoring perishability’s impact (e.g.,,(14(- )24)). This model uniquely integrated subsidies and fixed pricing, employing discount tools to coordinate manufacturers and distributors, effectively reducing bankruptcy risks in decentralized setups. This approach not only boosted overall supply chain profit and drug availability but also provided actionable insights for policymakers, addressing a significant gap in the literature. The combination of these innovative elements sets this work apart, as validated by multi-scenario analysis, and lays a strong foundation for future research in subsidized, perishable supply chains.
The paper is structured as follows: The introduction provides background and literature review; Materials and methods define the problem and present mathematical models for supply chain coordination; Results provide numerical experiments and sensitivity analyses for managerial insights; Discussion analyzes the findings and compares coordination mechanisms; and Conclusion offers final insights and future research directions.
Materials and Methods
Financial imbalances in the two-stage pharmaceutical supply chain (manufacturer and distributor) in regulated markets may lead to bankruptcies, preventing final consumers from accessing controlled drugs. Government subsidies, such as a cost reduction for active pharmaceutical ingredients (APIs), and multi-manufacturer production licenses for generics reduce costs and enhance equitable access. However, fixed pricing fuels intense competition, and managers’ behavior in setting contracts based on competitors exacerbates financial instability.
These challenges, coupled with temperature-sensitive drug, reduce supply and limit patient access to essential drugs. This study investigates coordination mechanisms, quantity discounts, to address coordination failures and improve sustainable drug access (Figure 1).
These challenges, coupled with temperature-sensitive drug, reduce supply and limit patient access to essential drugs. This study investigates coordination mechanisms, quantity discounts, to address coordination failures and improve sustainable drug access (Figure 1).
Figure 1. A view of the members of the drug supply chain under investigation along with their
relationship with the government
The proposed model manages perishable drug inventory using the Weibull distribution, accounting for temperature and time, in line with regulated market cold chain standards to minimize waste. The demand function reflects real-world sales managers’ discount-setting behavior based on competitors, enhancing generic demand forecasting for pharmacies. Mathematical details are provided in Appendix A.
Notation and indices
The following notations are used throughout the paper:The model aids managers in designing sales promotions, optimizing pharmacy inventory, and preventing bankruptcies. Policymakers can adjust subsidies to lower production costs and enhance access. The following assumptions and notations are used through the whole paper.
| Indices | |
| J | The number of substitute products J={1,…,j,..,J} |
| Parameters | |
| Inventory level at time t. | |
| Time-varying deterioration rate at time t, |
|
| Temperature-dependent scale parameter. | |
| Temperature-dependent shape parameter. | |
| Annual market demand rate (units), a concave function dependent on quantity discount parameter and substitute product coordination parameter. | |
| Maximum estimated demand. | |
| Selling price per unit. | |
| Sensitivity of medication to quantity discount parameter. | |
| Quantity discount parameter offered to distributor (a decision variable). | |
| Sensitivity of the substitute product j to quantity discount parameter. | |
| Quantity discount parameter offered for substitute product j. | |
| Ordering cost per order for the distributor. | |
| Ordering cost per order for the manufacturer. | |
| Wholesale price per unit. | |
| Manufacturer's production cost per unit. | |
| Unit holding cost per year of distributor (excluding the interest charge). | |
| Interest earned per year. | |
| Opportunity interest loss per year. | |
| Percentage cost reduction due to subsidy. | |
| Replenishment cycle time (years). | |
| Order quantity (a decision variable). | |
| Distributor's average profit. | |
| Manufacturer's average profit. | |
| Supply chain's average profit. | |
Assumptions
The models proposed in this paper are based on the following assumptions:Pharmaceutical market
- Only generic drugs with expired patents are considered, potentially supplied by multiple manufacturers.
- Equation (1) calculates demand based on a base level (α), the discounts (λ), and competitors’ discounts (λsj), helping pharmacies predict medicine needs. This model reflects decisions by manufacturers and competitors’ sales managers on setting discounts, improving forecasting for generic drugs under fixed pricing. The formula is:
| (1) |
where
- The model assumes a fixed subsidy rate without disruptions in the subsidy process; instead, it evaluates how a stable subsidy (e.g., approximately 30% based on dollar pricing for imported APIs) impacts the supply chain's performance and coordination.
- Equation (2) models medicine spoilage over time using the Weibull distribution, accounting for temperature effects to meet pharmaceutical cold chain standards. This helps the supply chain adjust to real-world storage challenges, especially under fixed pricing conditions. The deterioration rate, based on Qin and Wang [21] for microbial growth and degradation under non-isothermal conditions, is defined as:
| (2) |
where
- Drugs become ineffective upon expiration; quality is assumed constant.
Mathematical model
- Infinite horizon with instantaneous inventory replenishment.
- No inventory shortages allowed. Drug shortages was not considered in the model, as the government's policy of granting licenses to multiple distributors and manufacturers aims to prevent shortages. If one entity cannot supply the market, another can step in to ensure continuity.
The proposed mathematical model
In this section, a mathematical model is proposed to formulate the problem.Coordinated supply chain – quantity discount
Quantity discount is a common policy in which the manufacturer (leader) encourages the distributor (follower) to order beyond its economic order quantity (EOQ) by offering a wholesale price discount for additional savings and compensating any potential profit loss.
Order Quantity
The distributor’s inventory at time 0 is
| (3) |
Distributor objective function
The distributor's objective function accounts for holding cost, revenue from sales, purchasing costs, ordering cost. A full mathematical exposition is available upon request. We have
(4)
Manufacturer objective function
Without coordination, the manufacturer follows the retailer's decision. Its profit comprises sales revenue, production cost, and setup cost; holding costs are ignored due to short storage periods. The objective function is:
Max π _ m = w (1- λ ) Q / T - cϑQ / T - O _ m / T
= 1/T [((1- λ ) w - cϑ ) D ( T + ( φ T ^( τ +1))/( τ +1)) - O _ m ]
Constraints
Expiration date: The replenishment period should not be bigger than the expiration date. If it is followed, not only can the capital be avoided, but also the company's reputation will not suffer.
Without coordination, the manufacturer follows the retailer's decision. Its profit comprises sales revenue, production cost, and setup cost; holding costs are ignored due to short storage periods. The objective function is:
= 1/
Constraints
Expiration date: The replenishment period should not be bigger than the expiration date. If it is followed, not only can the capital be avoided, but also the company's reputation will not suffer.
| (6) |
Distributor incentive constraint: The distributor’s profit under coordination mechanisms, such as quantity discounts, must be greater than or equal to its profit in a decentralized setting to incentivize coordination adoption. For mathematical details of π nc - d
| (7) |
Hence, the non-coordinated supply chain annual profit can be expressed as
| (8) |
Non-coordinated supply chain
The decentralized scenario is examined to model a realistic pharmaceutical supply chain where the manufacturer and distributor make independent decisions to maximize their own profits, reflecting common practices in regulated markets (33).
The decentralized scenario is examined to model a realistic pharmaceutical supply chain where the manufacturer and distributor make independent decisions to maximize their own profits, reflecting common practices in regulated markets (33).
Hence, the non-coordinated supply chain annual profit can be expressed as
| (9) |
Centralized
In this part, we assume the manufacturer and the retailer are willing to behave as an integrated firm. They determine the order quantity to maximize the channel profit together.
| (10) |
Solution methodology
This section presents a practical approach to optimize quantity discount rates, including the optimal order quantity Q, in a two-stage pharmaceutical supply chain, tailored to regulated markets like Iran, addressing financial imbalances and drug perishability. Using a systematic framework based on the Stackelberg model, it ensures a unique optimal solution to maximize chain profitability and equitable drug access (see Figure 2).
The process begins by confirming the existence and uniqueness of the optimal discount rateλ Q
The process begins by confirming the existence and uniqueness of the optimal discount rate
Figure 2. Steps of the solution methodology
Theorem 1.
Proof: To prove uniqueness, the first-order partial derivative of π QD - m λ
| (11) |
we would obtain:
(12) |
Considering Equation (12), taking the second-order partial derivative of π QD - m λ
| (13) |
This is a linear function and based on Eqs. (8), π QD - m λ *
It then models the Stackelberg interaction between the manufacturer (leader) and distributor (follower): the manufacturer announces the discount rateλ
This section examines coordination in the
It then models the Stackelberg interaction between the manufacturer (leader) and distributor (follower): the manufacturer announces the discount rate
This section examines coordination in the
two-stage pharmaceutical supply chain using quantity discounts within the Stackelberg approach:
- To determine the optimal discount rate
- To determine the optimal discount rate
The overall objective is to maximize total chain profit while ensuring sustainable access to
price-controlled medicines. In this process (Equation 10), the manufacturer, as the leader, adjusts the discount rate, while the distributor, as the follower, optimizes order quantities, fully satisfying the distributor incentive constraint.
Validation is conducted through multi-scenario analysis, comparing centralized (total profit focus) and decentralized (financial imbalance) settings. This confirms that the optimized discount rates and Q enhance profitability and stability, supporting sustainable drug supply while mitigating disruptions caused by misused discounts. Detailed mathematical models available upon request.
This study is theoretical and does not involve human subjects, thus no ethics committee approval was required. It adheres to the principles of the Helsinki Declaration.
Results
Case statement
In this section, a number of numerical examples are solved and the related results are analyzed. Let’s assume T=180 day (0.49 ϑ =70%
Om = $60/order, Od = $60/order, h = $3 unit/year,565 year t =0.01 t 0.01 η 1 . 2 β 1 λ  s1, 2 = 80%. Parameter values are hypothetical, based on typical ranges in Iran’s pharmaceutical market, to illustrate the model’s applicability in regulated settings (In the absence of real-world examples, this study prioritizes a theoretical framework to enhance generalizability across regulated pharmaceutical markets):
Om = $60/order, Od = $60/order, h = $3 unit/year,
s1, 2 = 80%. Parameter values are hypothetical, based on typical ranges in Iran’s pharmaceutical market, to illustrate the model’s applicability in regulated settings (In the absence of real-world examples, this study prioritizes a theoretical framework to enhance generalizability across regulated pharmaceutical markets): Table 2. Sensitivity analysis of parameters on discount rate, order quantity, and supply chain profit
| Parameter | Range | Trend ( |
|||
| w | 25 - 75 | 0.565-0.655 | 47,707-57,123 | 8,800-12,500 | Decreasing / Decreasing |
| 0.25 - 0.75 | 0.6075-0.6125 | 52,410-52,935 | 10,900-11,100 | Increasing / Increasing | |
| 0.5 - 1 | 0.6075-0.61 | 52,410-52,673 | 10,900-11,000 | Increasing / Increasing | |
| 0.4 - 1.0 | 0.6075-0.61125 | 52,410-52,804 | 10,900-11,050 | Increasing / Increasing | |
| 0.35 - 1 | 0.5875-0.6325 | 50,190-55,156 | 9,900-12,100 | Increasing / Increasing | |
| 282.5 - 847.5 | 0.61 | 26,336-79,010 | 5,500-16,500 | Increasing / Increasing |
The sensitivity analysis, Table (2), assesses how key parameters shape supply chain performance, offering insights for decision-makers. Government-set subsidies (ϑ α η j λ β 1
This integrated sensitivity analysis, based on variations in deterioration rate parametersϕ τ τ ϕ τ ϕ
This integrated sensitivity analysis, based on variations in deterioration rate parameters
Table 3. Sensitivity of total supply chain profit to deterioration rate parameters
| 0.1 | 0.2 | 0.3 | 0.4 | 0.5 | 0.6 | 0.7 | 0.8 | 0.9 | 1 | ||
| 0.1 | 11,200 | 11,150 | 11,100 | 11,050 | 11,000 | 10,950 | 10,900 | 10,850 | 10,800 | 10,750 | |
| 0.2 | 11,150 | 11,100 | 11,050 | 11,000 | 10,950 | 10,900 | 10,850 | 10,800 | 10,750 | 10,700 | |
| 0.3 | 11,100 | 11,050 | 11,000 | 10,950 | 10,900 | 10,850 | 10,800 | 10,750 | 10,700 | 10,650 | |
| 0.4 | 11,050 | 11,000 | 10,950 | 10,900 | 10,850 | 10,800 | 10,750 | 10,700 | 10,650 | 10,600 | |
| 0.5 | 11,000 | 10,950 | 10,900 | 10,850 | 10,800 | 10,750 | 10,700 | 10,650 | 10,600 | 10,550 | |
| 0.6 | 10,950 | 10,900 | 10,850 | 10,800 | 10,750 | 10,700 | 10,650 | 10,600 | 10,550 | 10,500 | |
| 0.7 | 10,900 | 10,850 | 10,800 | 10,750 | 10,700 | 10,650 | 10,600 | 10,550 | 10,500 | 10,450 | |
| 0.8 | 10,850 | 10,800 | 10,750 | 10,700 | 10,650 | 10,600 | 10,550 | 10,500 | 10,450 | 10,400 | |
| 0.9 | 10,800 | 10,750 | 10,700 | 10,650 | 10,600 | 10,550 | 10,500 | 10,450 | 10,400 | 10,350 | |
| 1 | 10,750 | 10,700 | 10,650 | 10,600 | 10,550 | 10,500 | 10,450 | 10,400 | 10,350 | 10,300 | |
Table 4. Sensitivity of order quantity to deterioration rate parameters
pharmaceutical supply chain
| 0.1 | 0.2 | 0.3 | 0.4 | 0.5 | 0.6 | 0.7 | 0.8 | 0.9 | 1 | ||
| 0.1 | 51,549 | 51,849 | 52,149 | 52,449 | 52,749 | 53,049 | 53,349 | 53,649 | 53,949 | 54,249 | |
| 0.2 | 51,849 | 52,149 | 52,449 | 52,749 | 53,049 | 53,349 | 53,649 | 53,949 | 54,249 | 54,549 | |
| 0.3 | 52,149 | 52,449 | 52,749 | 53,049 | 53,349 | 53,649 | 53,949 | 54,249 | 54,549 | 54,849 | |
| 0.4 | 52,449 | 52,749 | 53,049 | 53,349 | 53,649 | 53,949 | 54,249 | 54,549 | 54,849 | 55,149 | |
| 0.5 | 52,749 | 53,049 | 53,349 | 53,649 | 53,949 | 54,249 | 54,549 | 54,849 | 55,149 | 55,449 | |
| 0.6 | 53,049 | 53,349 | 53,649 | 53,949 | 54,249 | 54,549 | 54,849 | 55,149 | 55,449 | 55,749 | |
| 0.7 | 53,349 | 53,649 | 53,949 | 54,249 | 54,549 | 54,849 | 55,149 | 55,449 | 55,749 | 56,049 | |
| 0.8 | 53,649 | 53,949 | 54,249 | 54,549 | 54,849 | 55,149 | 55,449 | 55,749 | 56,049 | 56,349 | |
| 0.9 | 53,949 | 54,249 | 54,549 | 54,849 | 55,149 | 55,449 | 55,749 | 56,049 | 56,349 | 56,649 | |
| 1 | 54,249 | 54,549 | 54,849 | 55,149 | 55,449 | 55,749 | 56,049 | 56,349 | 56,649 | 56,949 | |
Economically, this highlights a trade-off: higher Q* addresses shortages but escalates costs, reducing the return on investment (ROI) for cold storage below 10% unless subsidized. Distributors should invest in temperature-controlled infrastructure, though initial costs (e.g., $50,000 per facility) necessitate phased implementation. Policymakers can enhance accessibility by offering region-specific logistics subsidies, up to 20% of cold chain costs, or a 30% raw material cost reduction, as seen in Iran, to lower prices and improve equity. Compared to non-coordinated scenarios, coordination mitigates these losses, yet long-term sustainability requires balancing order volumes with storage capacity.
Table 5. Sensitivity analysis of parameters on the example
| Parameters | Centralized | Quantity discount | Non-coordinated | ||||
| 50 | 20,845 | 5,855 | 52,673 | 5,500 | 20,845 | 4,905 | |
| 75 | 20,845 | 8,782 | 52,673 | 8,250 | 20,845 | 7,357 | |
| 100 | 20,845 | 11,710 | 52,673 | 11,000 | 20,845 | 9,810 | |
| 125 | 20,845 | 14,638 | 52,673 | 13,750 | 20,845 | 12,262 | |
| 150 | 20,845 | 17,565 | 52,673 | 16,500 | 20,845 | 14,715 | |
| 25 | 20,845 | 11,710 | 52,205 | 10,750 | 20,845 | 9,810 | |
| 37.5 | 20,845 | 11,710 | 52,439 | 10,875 | 20,845 | 9,810 | |
| 50 | 20,845 | 11,710 | 52,673 | 11,000 | 20,845 | 9,810 | |
| 62.5 | 20,845 | 11,710 | 52,907 | 11,125 | 20,845 | 9,810 | |
| 90 | 20,845 | 11,710 | 53,141 | 11,250 | 20,845 | 9,810 | |
| 15 | 20,845 | 12,795 | 52,673 | 11,500 | 20,845 | 10,895 | |
| 22.5 | 20,845 | 12,252 | 52,673 | 11,250 | 20,845 | 10,352 | |
| 30 | 20,845 | 11,710 | 52,673 | 11,000 | 20,845 | 9,810 | |
| 37.5 | 20,845 | 11,167 | 52,673 | 10,750 | 20,845 | 9,267 | |
| 45 | 20,845 | 10,625 | 52,673 | 10,500 | 20,845 | 8,725 | |
Sensitivity analysis of parameters on the example
| Parameters | Centralized | Quantity discount | Non-coordinated | ||||
 |
35% | 20,845 | 10,625 | 52,673 | 10,500 | 20,845 | 8,725 |
| 52.5% | 20,845 | 11,167 | 52,673 | 10,750 | 20,845 | 9,267 | |
| 70% | 20,845 | 11,710 | 52,673 | 11,000 | 20,845 | 9,810 | |
| 87.5% | 20,845 | 12,252 | 52,673 | 11,250 | 20,845 | 10,352 | |
| 100% | 20,845 | 12,795 | 52,673 | 11,500 | 20,845 | 10,895 | |
| Od | 30 | 20,845 | 11,760 | 52,673 | 11,050 | 20,845 | 9,860 |
| 45 | 20,845 | 11,735 | 52,673 | 11,025 | 20,845 | 9,835 | |
| 60 | 20,845 | 11,710 | 52,673 | 11,000 | 20,845 | 9,810 | |
| 75 | 20,845 | 11,685 | 52,673 | 10,975 | 20,845 | 9,785 | |
| 90 | 20,845 | 11,660 | 52,673 | 10,950 | 20,845 | 9,760 | |
| Om | 30 | 20,845 | 11,760 | 52,673 | 11,050 | 20,845 | 9,860 |
| 45 | 20,845 | 11,735 | 52,673 | 11,025 | 20,845 | 9,835 | |
| 60 | 20,845 | 11,710 | 52,673 | 11,000 | 20,845 | 9,810 | |
| 75 | 20,845 | 11,685 | 52,673 | 10,975 | 20,845 | 9,785 | |
| 90 | 20,845 | 11,660 | 52,673 | 10,950 | 20,845 | 9,760 | |
| 10,422 | 5,855 | 26,336 | 5,500 | 10,422 | 4,905 | ||
| 15,634 | 8,782 | 39,505 | 8,250 | 15,634 | 7,357 | ||
| 20,845 | 11,710 | 52,673 | 11,000 | 20,845 | 9,810 | ||
| 26,056 | 14,638 | 65,842 | 13,750 | 26,056 | 12,262 | ||
| 31,268 | 17,565 | 79,010 | 16,500 | 31,268 | 14,715 | ||
| h | 1.5 | 20,845 | 11,760 | 52,673 | 11,050 | 20,845 | 9,860 |
| 2.25 | 20,845 | 11,735 | 52,673 | 11,025 | 20,845 | 9,835 | |
| 3 | 20,845 | 11,710 | 52,673 | 11,000 | 20,845 | 9,810 | |
| 3.75 | 20,845 | 11,685 | 52,673 | 10,975 | 20,845 | 9,785 | |
| 4.5 | 20,845 | 11,660 | 52,673 | 10,950 | 20,845 | 9,760 | |
| 90 | 10,422 | 5,855 | 26,336 | 5,500 | 10,422 | 4,905 | |
| 135 | 15,634 | 8,782 | 39,505 | 8,250 | 15,634 | 7,357 | |
| 180 | 20,845 | 11,710 | 52,673 | 11,000 | 20,845 | 9,810 | |
| 225 | 26,056 | 14,638 | 65,842 | 13,750 | 26,056 | 12,262 | |
| 270 | 31,268 | 17,565 | 79,010 | 16,500 | 31,268 | 14,715 | |
| 5 | 20,853 | 11,760 | 52,907 | 11,125 | 20,853 | 9,860 | |
| 7.5 | 20,849 | 11,735 | 52,790 | 11,062 | 20,849 | 9,835 | |
| 10 | 20,845 | 11,710 | 52,673 | 11,000 | 20,845 | 9,810 | |
| 12.5 | 20,841 | 11,685 | 52,556 | 10,937 | 20,841 | 9,785 | |
| 15 | 20,837 | 11,660 | 52,439 | 10,875 | 20,837 | 9,760 | |
| 0.005 | 17,721 | 10,010 | 46,677.03 | 9,750 | 17,721 | 8,390 | |
| 0.0075 | 19,283 | 10,860 | 49,675.38 | 10,375 | 19,283 | 9,100 | |
| 0.01 | 20,845 | 11,710 | 52,673.74 | 11,000 | 20,845 | 9,810 | |
| 0.0125 | 22,407 | 12,560 | 55,672.09 | 11,625 | 22,407 | 10,520 | |
| 0.015 | 23,968 | 13,410 | 58,670.44 | 12,250 | 23,968 | 11,230 | |
Sensitivity analysis of parameters on the example
| Parameters | Centralized | Quantity discount | Non-coordinated | ||||
| 20,853 | 11,760 | 52,907 | 11,125 | 20,853 | 9,860 | ||
| 20,849 | 11,735 | 52,790 | 11,062 | 20,849 | 9,835 | ||
| 20,845 | 11,710 | 52,673 | 11,000 | 20,845 | 9,810 | ||
| 20,841 | 11,685 | 52,556 | 10,937 | 20,841 | 9,785 | ||
| 20,837 | 11,660 | 52,439 | 10,875 | 20,837 | 9,760 | ||
| 0.005 | 17,721 | 10,010 | 46,677.03 | 9,750 | 17,721 | 8,390 | |
| 0.0075 | 19,283 | 10,860 | 49,675.38 | 10,375 | 19,283 | 9,100 | |
| 0.01 | 20,845 | 11,710 | 52,673.74 | 11,000 | 20,845 | 9,810 | |
| 0.0125 | 22,407 | 12,560 | 55,672.09 | 11,625 | 22,407 | 10,520 | |
| 0.015 | 23,968 | 13,410 | 58,670.44 | 12,250 | 23,968 | 11,230 | |
| 0.5 |
20,845 | 11,710 | 52,439 | 10,875 | 20,845 | 9,810 | |
| 0.75 |
20,845 | 11,710 | 52,556 | 10,937 | 20,845 | 9,810 | |
| 20,845 | 11,710 | 52,673 | 11,000 | 20,845 | 9,810 | ||
| 1.25 |
20,845 | 11,710 | 52,790 | 11,062 | 20,845 | 9,810 | |
| 1.5 |
20,845 | 11,710 | 52,907 | 11,125 | 20,845 | 9,810 | |
The sensitivity analysis presented in the comprehensive Table (5) highlights the impact of various parameters on profit and order quantity across centralized, non-coordinated, and coordinated (quantity discount) pharmaceutical supply chain scenarios to valid results. Since subsidies and p are set by the government, and η j λ α β 1 η j
The constancy of Q*in centralized and non-coordinated scenarios for parameters like www, ccc, and ϑ α
Managerial perspective: Consider a recent case in Iran’s pharmaceutical market: a distributor, pressured by competitors, offered steep discounts on a temperature-sensitive generic medicine, only to face spoilage losses and financial strain within months. This wake-up call reveals a troubling trend, and many stakeholders fixate on competitive discounting (η j λ α ϑ τ ϕ
The sensitivity analyses Tables 2 to 5 underscore this oversight. Boosting potential demand (α β 1 β 1 ϑ
Distributors and manufacturers must shift from blind competition to parameter-driven strategies, integrating marketing (α β 1
The constancy of Q*in centralized and non-coordinated scenarios for parameters like www, ccc, and
Managerial perspective: Consider a recent case in Iran’s pharmaceutical market: a distributor, pressured by competitors, offered steep discounts on a temperature-sensitive generic medicine, only to face spoilage losses and financial strain within months. This wake-up call reveals a troubling trend, and many stakeholders fixate on competitive discounting (
The sensitivity analyses Tables 2 to 5 underscore this oversight. Boosting potential demand (
Distributors and manufacturers must shift from blind competition to parameter-driven strategies, integrating marketing (
Discussion
In this study, a mathematical modeling approach was employed to analyze the impacts of fixed pricing, government subsidies, and discount strategies on a two-stage pharmaceutical supply chain, focusing on regulated markets such as Iran. The primary goal of this analysis was to examine how coordination mechanisms, incorporating perishability and competitor-sensitive demand, can mitigate financial imbalances, reduce drug shortages, and enhance overall supply chain performance. The results indicate that adherence to optimized discount and subsidy strategies not only boosts profitability but also improves drug availability and equitable access, particularly for generic medicines in underserved regions.
Across the evaluated scenarios (decentralized, centralized, and coordinated) there is a clear emphasis on the role of quantity discounts in aligning incentives between manufacturers and distributors. For instance, in the coordinated model, optimizing discount rates (λ
Perishability management emerges as a critical factor in all scenarios. Using the Weibull distribution to model drug deterioration, the analysis reveals a trade-off: higher deterioration rates reduce profits by up to 5% due to spoilage losses but necessitate larger order quantities to prevent shortages (Tables 3 and 4). This underscores the need for cold chain investments, particularly in regulated markets like Iran where temperature-sensitive drugs are prevalent. These results correspond with findings from Maleki et al. (16), which demonstrated that coordination in perishable supply chains, such as for organic products, leads to reduced waste and improved sustainability through aligned freshness-preserving strategies.
Subsidies and fixed pricing are also emphasized as core elements influencing chain dynamics. The model shows that increasing subsidy levels from low to high enhances profitability and order quantities, but benefits plateau beyond 0.8, indicating potential dependency risks (Table 2). In competitor-sensitive demand functions incorporatingλs j
Furthermore, the novel demand prediction approach, sensitive to discounts (λ λs j
The strategic role of coordinated discount strategies in ensuring the sustainability of pharmaceutical supply chains is undeniable; neglecting these can lead to persistent shortages and financial instability. Ultimately, integrating subsidies with coordination mechanisms provides a strategic advantage for policymakers and managers in regulated markets (2).
Across the evaluated scenarios (decentralized, centralized, and coordinated) there is a clear emphasis on the role of quantity discounts in aligning incentives between manufacturers and distributors. For instance, in the coordinated model, optimizing discount rates (
Perishability management emerges as a critical factor in all scenarios. Using the Weibull distribution to model drug deterioration, the analysis reveals a trade-off: higher deterioration rates reduce profits by up to 5% due to spoilage losses but necessitate larger order quantities to prevent shortages (Tables 3 and 4). This underscores the need for cold chain investments, particularly in regulated markets like Iran where temperature-sensitive drugs are prevalent. These results correspond with findings from Maleki et al. (16), which demonstrated that coordination in perishable supply chains, such as for organic products, leads to reduced waste and improved sustainability through aligned freshness-preserving strategies.
Subsidies and fixed pricing are also emphasized as core elements influencing chain dynamics. The model shows that increasing subsidy levels from low to high enhances profitability and order quantities, but benefits plateau beyond 0.8, indicating potential dependency risks (Table 2). In competitor-sensitive demand functions incorporating
Furthermore, the novel demand prediction approach, sensitive to discounts (
The strategic role of coordinated discount strategies in ensuring the sustainability of pharmaceutical supply chains is undeniable; neglecting these can lead to persistent shortages and financial instability. Ultimately, integrating subsidies with coordination mechanisms provides a strategic advantage for policymakers and managers in regulated markets (2).
Limitations
This study employs a theoretical model with an infinite horizon assumption, which may not fully capture real-world constraints like seasonal demand fluctuations or sudden supply disruptions, potentially reducing the applicability of results in dynamic health systems where patient needs vary temporally. The sensitivity analysis relies on simulated data due to limited access to empirical records in Iran, which could limit generalizability and overlook context-specific factors such as regional disparities in infrastructure, thereby affecting the model's ability to predict impacts on patient access in underserved areas. Additionally, the model assumes uniform cold chain compliance, which may not hold in low-resource settings, constraining the scalability of subsidy and discount strategies for equitable drug distribution. Despite these limitations, the framework provides a robust tool for policy testing, validated by comprehensive sensitivity analyses (Tables 2-5), and offering actionable insights for improving health outcomes.
Future research directions: Future research could enhance applicability by incorporating real-time data from pharmacies to validate the model empirically and addressing regional variations in infrastructure through case studies in underserved Iranian regions. Additionally, leveraging machine learning techniques, such as neural networks, could improve demand prediction by analyzing historical sales and external factors like economic fluctuations, leading to more adaptive discount strategies. Modeling multi-stage supply chains (e.g., including retailers and patients) would capture complex interactions, such as end-to-end distribution delays, providing a more holistic view of subsidy effects on patient access and health equity.
Future research directions: Future research could enhance applicability by incorporating real-time data from pharmacies to validate the model empirically and addressing regional variations in infrastructure through case studies in underserved Iranian regions. Additionally, leveraging machine learning techniques, such as neural networks, could improve demand prediction by analyzing historical sales and external factors like economic fluctuations, leading to more adaptive discount strategies. Modeling multi-stage supply chains (e.g., including retailers and patients) would capture complex interactions, such as end-to-end distribution delays, providing a more holistic view of subsidy effects on patient access and health equity.
Conclusion
This study demonstrates how fixed pricing, government subsidies, and misused discounts in regulated markets like Iran, Canada, and Japan contribute to financial instability and medicine shortages, with significant implications for patient access to essential drugs, particularly in underserved regions. By optimizing discount strategies alongside subsidies, the proposed framework enhances supply chain coordination, improving profitability and drug availability, which can lower prices and strengthen equitable health outcomes. Effective subsidies, when aligned with these strategies, stabilize the supply chain, offering policymakers a tool to bolster infrastructure (e.g., cold chains) and ensure reliable access for vulnerable populations. Managers can leverage optimized discount practices to mitigate shortages, while challenges like centralized control and uncoordinated systems underscore the need for integrated approaches. The model’s theoretical nature and reliance on simulated data limit its generalizability, particularly in capturing dynamic patient needs and regional disparities, yet it provides a robust foundation for policy testing.
Future efforts should focus on empirical validation with real-time pharmacy data to address these limitations, alongside advanced techniques like machine learning (e.g., neural networks) for accurate demand forecasting tailored to health needs. Modeling multi-stage supply chains, including retailers and patients, could reveal end-to-end impacts on drug distribution and equity. Additionally, exploring innovative collaboration models between policymakers and health providers could enhance the scalability of these strategies in diverse healthcare settings.
Future efforts should focus on empirical validation with real-time pharmacy data to address these limitations, alongside advanced techniques like machine learning (e.g., neural networks) for accurate demand forecasting tailored to health needs. Modeling multi-stage supply chains, including retailers and patients, could reveal end-to-end impacts on drug distribution and equity. Additionally, exploring innovative collaboration models between policymakers and health providers could enhance the scalability of these strategies in diverse healthcare settings.
Ethical considerations
This study is a theoretical research conducted as part of a PhD dissertation in Industrial Engineering at Yazd University, registered with the tracking code 1712387 at the Iran National Research Repository (IRANDOC) on May 7, 2022. Additionally, a certificate of non-plagiarism (No. 804309) has been obtained on April 9, 2022. As the study involves no human subjects, animal experiments, or clinical data, no ethics committee approval was required. The research adheres to the principles of the Helsinki Declaration (revised 2013) for theoretical studies, ensuring scientific integrity and transparency.
Acknowledgments
The authors gratefully acknowledge the support of the Department of Industrial Engineering at Yazd University and the contributions of colleagues in refining this research.
Authors’ contributions
F.O contributed to the conceptualization, methodology, and writing of the original draft; H.K.Z was responsible for writing, review, and editing; Y.Z.M and M.B.F provided supervision. All authors read and approved the final manuscript.
Conflict of interests
The authors declared no conflicts of interest.
Funding
This research was conducted as part of a PhD dissertation at Yazd University and received no external funding.
References
1. Odumbo O, Asorose E, Oluwagbade E, Alemede V. Reengineering sustainable pharmaceutical supply chains to improve therapeutic equity in US underserved health regions. Int J Eng Technol Res Manag. 2024;8(6):208.
2. Bastani P, Dinarvand R, SamadBeik M, Pourmohammadi K. Pharmaceutical strategic purchasing requirements in Iran: Price interventions and the related effective factors. Journal of Research in Pharmacy Practice. 2016;5(1):35-42.
3. Ma J, Hou Y, Wang Z, Yang W. Pricing strategy and coordination of automobile manufacturers based on government intervention and carbon emission reduction. Energy Policy. 2021;148:111919.
4. Patil AR, Stephen SM. Price control policies for medicines: How far the accessibility is achieved by patients? Asian Journal of Legal Education. 2025;12(1):98-112.
5. Yousefi N, Moradi N, Dinarvand R, Ghiasi G, Inanloo H, Peiravian F. Policies to improve access to pharmaceutical products in shortage: The experience of Iran food and drug administration. DARU Journal of Pharmaceutical Sciences. 2019;27:169-77.
6. Ozawa S, Higgins CR, Yemeke TT, Nwokike JI, Evans L, Hajjou M, et al. Importance of medicine quality in achieving universal health coverage. PLoS One. 2020;15(7):e0232966.
7. Alkhouri M. Pharmaceutical supply chain–new obstacles and challenges. 2024.
8. Amjad K, Javeed MR, Umar M, Khalid MS, Gelani HE, Dastgeer F, editors. ANN based optimization of price-based demand response management for solar powered nanogrids. 2020 IEEE 23rd International Multitopic Conference (INMIC); 2020: IEEE.
9. Bashirynejad M, Soleymani F, Nikfar S, Kebriaeezadeh A, Majdzadeh R, Zackery A, et al. Iranian pharmaceutical industry future trends: An expert panel analysis. Journal of Pharmacoeconomics and Pharmaceutical Management. 2025;11(01):24-33.
10. Cheraghali AM. Trends in Iran pharmaceutical market. Iranian Journal of Pharmaceutical Research: IJPR. 2017;16(1):1.
11. Mulcahy A, Whaley C, Tebeka M, Schwarn D, Edemfield N, Becerra-Oenelas A. International prescription drug price comparisons. Santa Monica: RAND Corporation. 2021.
12. Bilal AI, Bititci US, Fenta TG. Effective supply chain strategies in addressing demand and supply uncertainty: a case study of ethiopian pharmaceutical supply services. Pharmacy. 2024; 12(5):132.
13. Haider R, Mehdi A, Zehra A, Das GK, Ahmed Z. Corruption in the pharmaceutical sector diagnosing the challenges. International Journal of Integrative Sciences. 2024;3(3):237-78.
14. Kwon YW, Sheu J-B, Talluri S, Yoon J, Yoo SH. Performance of quantity discount contract under supply and demand disruptions. IEEE Transactions on Engineering Management. 2024;71:5782-97.
15. Zhao H, Song S, Liao Y, Yue F, Wang R, editors. Performance in the supply chain with a loss-averse retailer with random demand. 2017 36th Chinese Control Conference (CCC); 2017: IEEE.
16. Maleki F, Yaghoubi S, Fander A. Organic level vs. sales effort in coordination of green food supply chain for deteriorating items. Environment, Development and Sustainability. 2023;25(11): 13065-97.
17. Ran W, Chen Y. Fresh produce supply chain coordination based on freshness preservation strategy. Sustainability. 2023;15(10):8184.
18. Wang Y, Deng X, Lu Q, Guan M, Lu F, Wu X. Developing platform supply chain contract coordination and a numerical analysis considering fresh-keeping services. Sustainability. 2023;15(18): 13586.
19. Choi T-M. Supply chain financing using blockchain: Impacts on supply chains selling fashionable products. Annals of Operations Research. 2023;331(1):393-415.
20. Luo M, Zhou G, Xu H. A differential game model research on dynamic pricing and coordination of fresh agricultural products supply chain based on freshness. Economic Research-Ekonomska Istraživanja. 2023; 36(2):2177696.
21. Jian J, Li B, Zhang N, Su J. Decision-making and coordination of green closed-loop supply chain with fairness concern. Journal of Cleaner Production. 2021;298:126779.
22. Chen T, Liu C, Xu X. Coordination of perishable product supply chains with a joint contract under yield and demand uncertainty. Sustainability. 2022;14(19):12658.
23. Zhang T-z, Lu S-c, editors. Study on win-win of coordinating supply chain. 2011 International Conference on Business Management and Electronic Information; 2011: IEEE.
24. Ravithammal M, Uthayakumar R, Ganesh S. An integrated production inventory system for perishable items with fixed and linear back orders. International Journal of Mathematical Analysis. 2014;8(32):1549-59.
25. Mahata P, Gupta A, Mahata GC. Optimal pricing and ordering policy for an EPQ inventory system with perishable items under partial trade credit financing. International Journal of Operational Research. 2014;21(2):221-51.
26. Bai X. Research on coordination of perishable products supply chain with the combined option and quantity discount contract. ICLEM 2010: Logistics for Sustained Economic Development: Infrastructure, Information, Integration; 2010. p. 4262-8.
27. Zhang Q-H, Luo J-W. Coordination of a buyer-vendor supply chain for a perishable product under symmetric and asymmetric information. Asia-Pacific Journal of Operational Research. 2011;28(05):673-88.
28. Wang T, Hu Q, editors. Coordination of supply chain with advertise-setting newsvendor. 2nd International Conference on Advanced Computer Control; 2010: IEEE.
29. Zhang Q, Luo J, Duan Y. Buyer–vendor coordination for fixed lifetime product with quantity discount under finite production rate. International Journal of Systems Science. 2016;47(4):821-34.
30. Muniappan P, Uthayakumar R, Ganesh S. A production inventory model for vendor–buyer coordination with quantity discount, backordering and rework for fixed life time products. Journal of Industrial and Production Engineering. 2016;33(6): 355-62.
31. Mamoudan MM, Mohammadnazari Z, Ostadi A, Esfahbodi A. Food products pricing theory with application of machine learning and game theory approach. International Journal of Production Research. 2022:1-21.
32. Cai X, Chen J, Xiao Y, Xu X, Yu G. Fresh-product supply chain management with logistics outsourcing. Omega. 2013;41(4):752-65.
33. Arshinder K, Kanda A, Deshmukh S. A review on supply chain coordination: coordination mechanisms, managing uncertainty and research directions. Supply Chain Coordination Under Uncertainty. 2011:39-82.
Type of Study: Original article |
Subject:
Health Economics
Received: 2025/09/16 | Accepted: 2026/03/27 | Published: 2026/06/1
Received: 2025/09/16 | Accepted: 2026/03/27 | Published: 2026/06/1
Send email to the article author
| Rights and permissions | |
 |
This work is licensed under a Creative Commons Attribution-NonCommercial 4.0 International License. |
