

Volume 9, Issue 3 (10-2025)
EBHPME 2025, 9(3): 152-163 |
Back to browse issues page


Download citation:
BibTeX | RIS | EndNote | Medlars | ProCite | Reference Manager | RefWorks
Send citation to:


BibTeX | RIS | EndNote | Medlars | ProCite | Reference Manager | RefWorks
Send citation to:
Safi Najaf Abadi E, Amirfakhriyan M, Ameri H, Ranjbar M. Spatial Analysis of Access to Pharmacies and Medical Diagnostic Laboratories Using Geographic Information System (GIS): A Case Study of Yazd City. EBHPME 2025; 9 (3) :152-163
URL: http://jebhpme.ssu.ac.ir/article-1-554-en.html
URL: http://jebhpme.ssu.ac.ir/article-1-554-en.html


Department of Health Management and Economics, School of Public Health, Shahid Sadoughi University of Medical Sciences, Yazd, Iran , ranjbar3079@gmail.com
Keywords: Medical Diagnostic Laboratory, Geographic Information System (GIS), Accessibility, Pharmacy
Full-Text [PDF 1280 kb]
(131 Downloads)
| Abstract (HTML) (253 Views)
Introduction
.JPG)
Figure 2. Clustered and dispersed pattern models
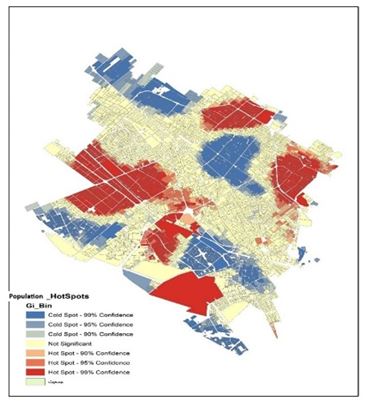
Figure 3. Population distribution in the areas of Yazd city based on hotspot analysis
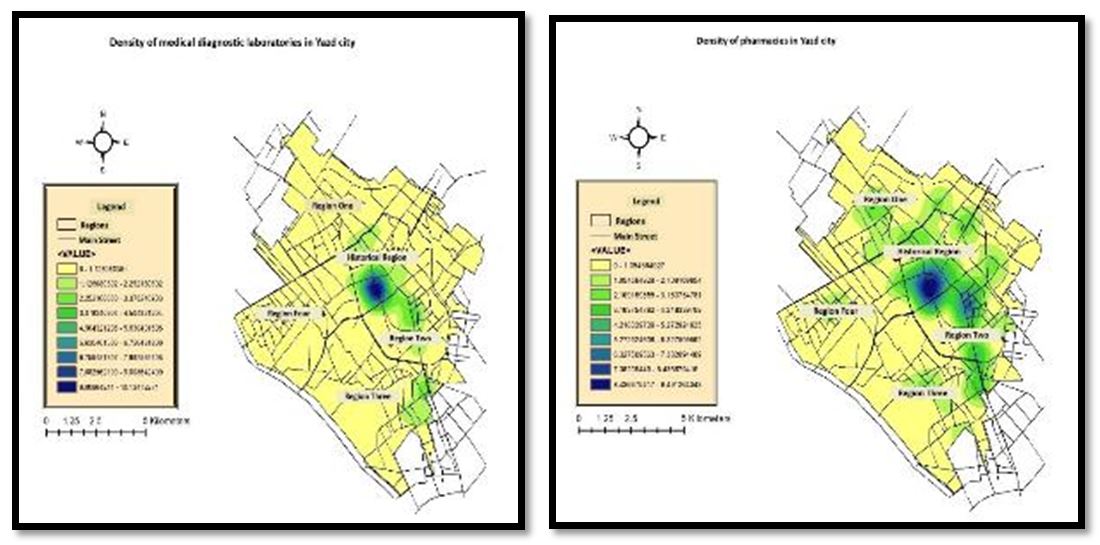
Figure 4. Density of medical laboratories and pharmacies
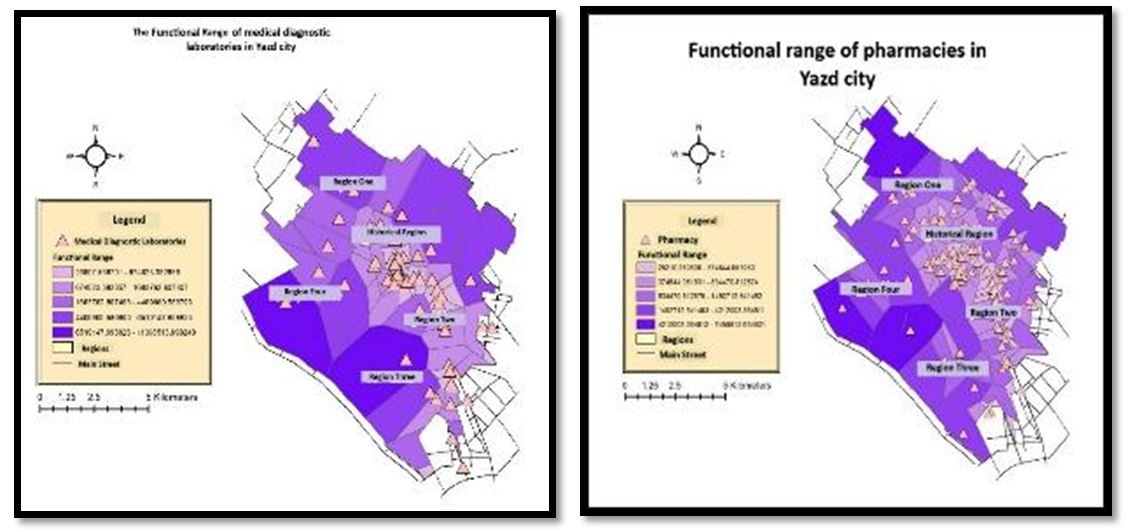
Figure 5. Functional areas of medical laboratories and pharmacies
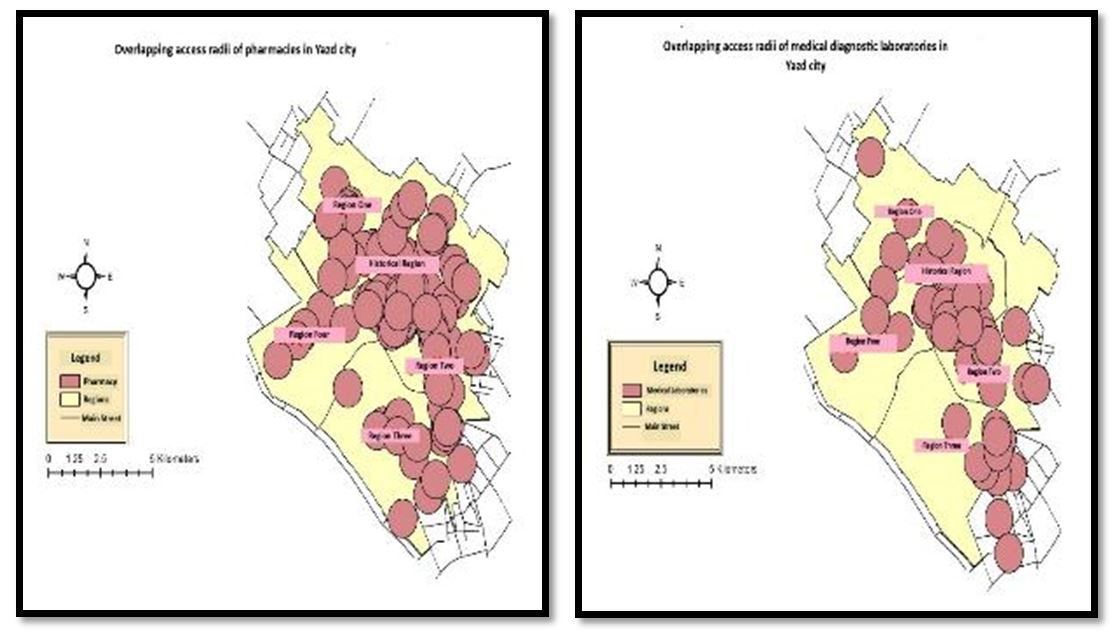
Figure 6. Overlap in the accessibility radius of medical laboratories and pharmacies
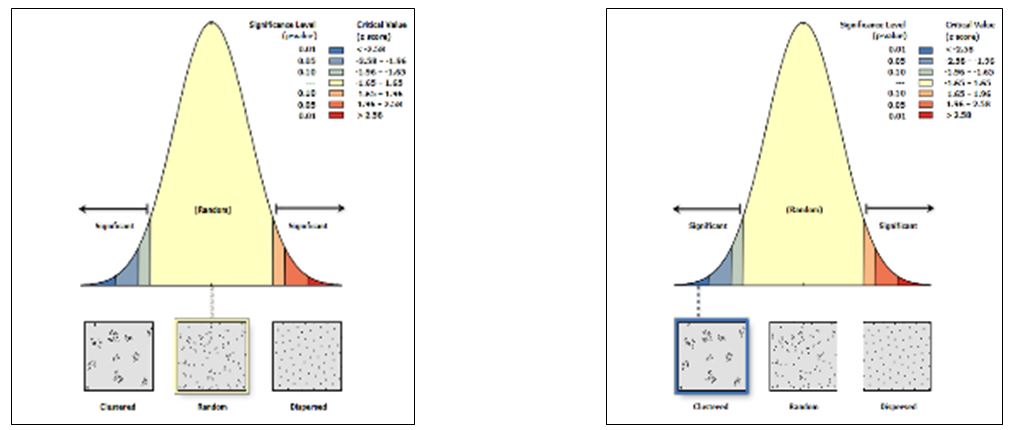
Figure 7. Dispersion pattern of medical laboratories and pharmacies
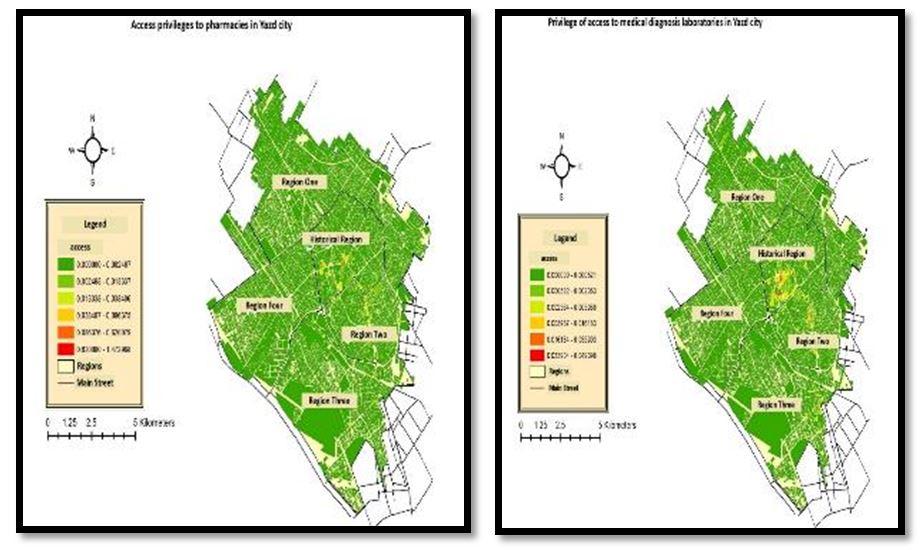
Figure 8. Accessibility scores for medical laboratories and pharmacies
Based on the map above, it can be concluded that, except for Areas 2 and Historical, the lowest accessibility to medical laboratories is observed in the other areas. Similarly, except for the historical area, the lowest accessibility to pharmacies was found in the other areas.
Discussion
Full-Text: (83 Views)
| A B S T R A C T Introduction: The unequal spatial distribution of healthcare services, such as pharmacies and diagnostic laboratories, is a major challenge in developing countries, leading to inequitable access. This study aimed to analyze the spatial distribution of these facilities in Yazd City using Geographic Information System (GIS) techniques to assess accessibility and equity. Materials and Methods: This descriptive analytical cross-sectional study was conducted in 2022. Data on the locations of pharmacies, medical diagnostic laboratories, and population distribution in Yazd were collected and mapped using ArcGIS software. Standards and indicators were identified through document review, and data were analyzed using GIS models, including Hot Spot Analysis, Thiessen Polygon, Two-Step Floating Catchment Area (2SFCA), and Nearest Neighbor Distance (NND). Results: The standard radius for medical laboratories is 700 meters and the accessibility score varies from 0 to 0.049. For pharmacies, the standard is one pharmacy per 7,000 people and the walking distance limit is 500 meters, with accessibility scores ranging from 0 to 1.47, indicating a slight difference in accessibility between the two uses. In fact, among the 57 diagnostic laboratories, the highest concentration was found in the historic district, which had a relatively low population density, indicating a random distribution. Pharmacies were mainly concentrated in District 2 and the historic districts. While the distribution in District 2 corresponded to population density, the historic district showed an oversupply of drugs relative to its population. Conclusion: Access to health facilities in Yazd is spatially uneven. In order to promote social justice and improve the quality of life, urban planning should consider population distribution to promote equitable access and social justice in urban environments. Keywords: Medical Diagnostic Laboratory, Geographic Information System (GIS), Accessibility, Pharmacy |
Introduction
One of the key issues for planners and decision-makers is equitable access to healthcare services, which governments have prioritized as a long-term objective (1-4). In addition, policymakers must consider the extent of services that can meet patients’ health needs and the time or distance they must travel to receive healthcare services when allocating medical resources (5).
Goal 3.8 of the third Sustainable Development Goals states: "Achieve universal health coverage, including financial risk protection, access to quality essential health services, and access to essential, effective, high-quality, and affordable medicines and vaccines for all" (6). Therefore, in line with this goal, medicines are a critical and inseparable part of the health system (7), and access to them is essential for improving health outcomes and achieving universal healthcare coverage (8). However, the inadequate spatial distribution of healthcare services, including pharmacies, remains a common issue across Iran (9, 10). These inequalities in access to healthcare facilities are weaknesses in governance that result from poor spatial distribution in the country or a specific geographic area of interest. This ultimately leads to public dissatisfaction (11, 12).
Various factors influence the geographic distribution of local pharmacies in a region, including population distribution and density, economic and labor markets, community support, access to primary care and hospital services, and policies related to drug reimbursement (13).
Moreover, healthcare systems in various countries worldwide face fragmentation and dispersion issues (14). This problem is also evident in laboratory services, where test results account for 60-70% of important clinical decisions. This issue leads to challenges such as a lack of accountability regarding costs and quality, instability in long-term services, non-patient-centered service delivery, absence of comprehensive information management systems, and lack of integrated management, all of which can be observed in laboratory services (15, 16).
Issues such as population growth, the rise of chronic diseases, and improvements in quality of life in recent years have led to an increased demand for the establishment of new healthcare service centers in South Korea. Before establishing a new healthcare facility, minimum requirements such as budget and optimal location must be met (10, 17, 18).
In this regard, and for the purpose of planning, monitoring, and evaluating healthcare systems, Geographic Information Systems (GIS) are used as a useful technology for collecting, storing, processing, analyzing, and visualizing spatial data, especially in developing countries. Currently, this technology has proven useful in ensuring that vulnerable and disadvantaged individuals access healthcare facilities and services (19, 20).
This software can highlight health inequalities between different regions, and mapping these inequalities and linking them to healthcare centers will significantly assist in the appropriate distribution of resources and improve geographical access for individuals (21, 22).
Given the application of this software in healthcare service access and the importance of equitable access to these centers in improving health and welfare, this study was conducted to analyze the spatial distribution of pharmacies and diagnostic laboratories using GISin Iran.
Materials and Methods
Study Area
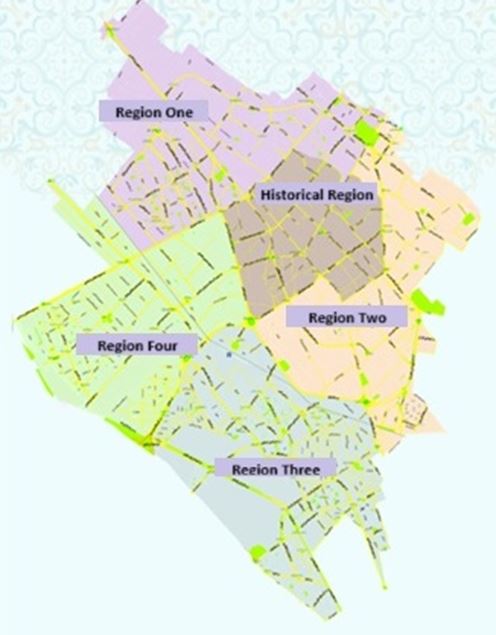
This descriptive-analytical study investigated spatial accessibility to healthcare services, specifically pharmacies and clinical diagnostic laboratories, in Yazd, Iran. Yazd, the capital of Yazd Province, is located in central Iran. According to the latest statistics from 2022, the city has a population of approximately 515,463 people and covers an area of approximately 10,730 square kilometers. The urban fabric of Yazd is officially divided into five administrative zones comprising four urban districts and one historical area (Figure 1). (23)
Goal 3.8 of the third Sustainable Development Goals states: "Achieve universal health coverage, including financial risk protection, access to quality essential health services, and access to essential, effective, high-quality, and affordable medicines and vaccines for all" (6). Therefore, in line with this goal, medicines are a critical and inseparable part of the health system (7), and access to them is essential for improving health outcomes and achieving universal healthcare coverage (8). However, the inadequate spatial distribution of healthcare services, including pharmacies, remains a common issue across Iran (9, 10). These inequalities in access to healthcare facilities are weaknesses in governance that result from poor spatial distribution in the country or a specific geographic area of interest. This ultimately leads to public dissatisfaction (11, 12).
Various factors influence the geographic distribution of local pharmacies in a region, including population distribution and density, economic and labor markets, community support, access to primary care and hospital services, and policies related to drug reimbursement (13).
Moreover, healthcare systems in various countries worldwide face fragmentation and dispersion issues (14). This problem is also evident in laboratory services, where test results account for 60-70% of important clinical decisions. This issue leads to challenges such as a lack of accountability regarding costs and quality, instability in long-term services, non-patient-centered service delivery, absence of comprehensive information management systems, and lack of integrated management, all of which can be observed in laboratory services (15, 16).
Issues such as population growth, the rise of chronic diseases, and improvements in quality of life in recent years have led to an increased demand for the establishment of new healthcare service centers in South Korea. Before establishing a new healthcare facility, minimum requirements such as budget and optimal location must be met (10, 17, 18).
In this regard, and for the purpose of planning, monitoring, and evaluating healthcare systems, Geographic Information Systems (GIS) are used as a useful technology for collecting, storing, processing, analyzing, and visualizing spatial data, especially in developing countries. Currently, this technology has proven useful in ensuring that vulnerable and disadvantaged individuals access healthcare facilities and services (19, 20).
This software can highlight health inequalities between different regions, and mapping these inequalities and linking them to healthcare centers will significantly assist in the appropriate distribution of resources and improve geographical access for individuals (21, 22).
Given the application of this software in healthcare service access and the importance of equitable access to these centers in improving health and welfare, this study was conducted to analyze the spatial distribution of pharmacies and diagnostic laboratories using GISin Iran.
Materials and Methods
Study Area
This descriptive-analytical study investigated spatial accessibility to healthcare services, specifically pharmacies and clinical diagnostic laboratories, in Yazd, Iran. Yazd, the capital of Yazd Province, is located in central Iran. According to the latest statistics from 2022, the city has a population of approximately 515,463 people and covers an area of approximately 10,730 square kilometers. The urban fabric of Yazd is officially divided into five administrative zones comprising four urban districts and one historical area (Figure 1). (23)
Figure 1. Map of the different districts of Yazd city
In this study, spatial and descriptive data on 114 active pharmacies and 57 clinical laboratories in Yazd were gathered from official sources, such as the Iranian Food and Drug Administration and Yazd Municipality. The exact locations of these healthcare centers were geocoded using postal codes in ArcGIS 10.8 software.
Simultaneously, population data at the census block level were obtained from the Statistical Center of Iran and uploaded into GIS environment. Two main data layers were prepared as follows.
Simultaneously, population data at the census block level were obtained from the Statistical Center of Iran and uploaded into GIS environment. Two main data layers were prepared as follows.
- Healthcare Facilities Layer: Contains geographic coordinates and the type of service provided (pharmacy or laboratory).
- Population Block Layer: This layer includes the spatial boundaries of census blocks and population figures for each block.
To evaluate the functional coverage and service radius of healthcare facilities, standards from the Supreme Council of Urban Planning and Architecture of Iran and related resources were used. The following baseline criteria were adopted:
- Pharmacy: Providing that there is an active private or public medical office with a population of up to three hundred thousand people for every 8,000 people and one pharmacy; for every 7,000 people of the entire population of the city or village another pharmacy should be established. (24, 25, 26, 27)
- Clinical Laboratory: Distance from each person to the pharmacy is 0.04 Square meter. The urban capacity for medical diagnostic laboratories is defined at the district level, based on the resolution of the Supreme Council of Architecture and Urban Planning of Iran; in other words, the radius of access of the covered elements located at the district level is estimated to be about 650 to 700 meters. (28, 29, 30)
These standards were used to delineate the service areas and determine the population coverage within GIS.
Spatial Access to Healthcare Facilities in Yazd City
Spatial Access to Healthcare Facilities in Yazd City
- Euclidean Distance (31):
This represents the direct distance between two points, without considering physical obstacles. In other words, this distance measures the straight-line distance between two points, disregarding the road network, which is also referred to as the "straight-line distance" or "airline distance."
- Thiessen Model (31):
One important criterion for measuring access is the population served by each healthcare facility. In other words, the population per healthcare facility was assessed. Using the Thiessen polygon algorithm (irregular polygons), the operational radius for each healthcare facility was first determined, and the population within each polygon was then calculated. Finally, using population statistics for each region and determining the proportion of each healthcare facility, the calculated values for the population served by the healthcare facilities were normalized.
- Access Model (31):
In previous studies, various methods have been used to analyze spatial access. These methods can be classified into three categories.
a) Access based on the distance between the population and facilities
b) Access based on the service radius of the facilities and the population covered by each service
c) Access based on the number of available facilities for individuals
Researchers have proposed different methods and models for calculating access within each category. However, each of these methods has its own advantages and disadvantages. The main flaw is that access is a combination of various methods, while the methods mentioned only address one aspect of access and thus lack comprehensiveness. To address this, models based on the "two-stage floating catchment area" (Wang & Luo, 2005) have been introduced, where spatial access to services is considered a function of the following factors:
- Population served by facilities: The higher the population served, the fewer the opportunities for individuals to access the facility, and vice versa.
- Distance from the facility: The shorter the distance between users and the facility, the easier and better the access to services.
- Choice options: The more options individuals have for accessing facilities, the better their access.
In this study, an "ACCESS" method, implemented in ArcGIS, was used based on the types of variables and available values for each. For this purpose, the operational radius and service area for each healthcare facility in Yazd City were first determined on the network. This value was set according to the existing standards. Population areas within the service areas of multiple healthcare facilities were assessed to determine how many healthcare facilities each area had appropriate access to. Subsequently, the distance of each population area to the nearest healthcare facility was calculated, and using the following formula, the access score for each population area to each healthcare facility was derived:
ACCESS=
The r_i value is calculated using the following formula (2).
Where:
ACCESS=
The r_i value is calculated using the following formula (2).
Where:
- di: Average network distance between the population in each area and the available facility options for that area.
- ni: Number of facility options available to the population of each area.
- pi: Population of each area.
To calculate this index, the required data were stored in two separate layers in GIS database: one layer for healthcare facilities classified by type and another for population blocks. The access score for each population block was calculated in six steps as follows:
Step 1: Consider the existing standards regarding the distance from each individual to healthcare facilities, categorized by type, using multiple sources and previous studies.
Step 2: Determine the healthcare facility each population block has access to and the corresponding distance. The resulting layer from this process was named "Distance to Facilities."
Step 3: Link the demographic data of each block to the "Distance to Facilities" layer using the JOIN command. The new layer generated in this step specifies both the distance to the nearest facility and the population of each block.
Step 4: The layer produced in Step 3 was linked to the "Service Radius of Healthcare Facilities" layer (resulting from Step 1) using the Spatial Join command. This was done to determine how many healthcare facilities each population block lies within the service radius. The newly generated layer in this step not only provides the population and distance of each block to the nearest facility but also specifies the number of facility options available for the access.
Step 5: The r index was calculated by dividing the "number of facilities" by the "population of the block."
Step 6: Using the ratio of the r index for each area to its distance from the nearest facility, the access index for each healthcare facility was determined.
Non-Spatial Access to Healthcare Facilities in Yazd City
- Average Nearest Neighbor Distance (32):
In this method, the nearest neighbor is calculated by the average distance from each feature to its closest neighboring feature. Then, the average of all nearest neighbor distances is calculated. If the average distance is less than the expected distance, the features are clustered in a pattern, indicating a clustered distribution. However, if the average distance is greater than expected, the features have a dispersed settlement pattern.
This model is derived from the ratio of the observed distance to the expected distance. The expected distance is the mean distance between neighbors, assuming a random distribution. If this index is less than one, it indicates a clustered pattern, whereas if it is greater than one, it indicates a dispersed pattern. Therefore, the implementation of this model classifies the features and phenomena under study into a range between clustered and dispersed patterns. A clustered pattern implies that the features are grouped closely together, whereas a dispersed pattern means that the features are distributed without any relationship to each other, as shown in the figure below. (Figure 2)
This model is derived from the ratio of the observed distance to the expected distance. The expected distance is the mean distance between neighbors, assuming a random distribution. If this index is less than one, it indicates a clustered pattern, whereas if it is greater than one, it indicates a dispersed pattern. Therefore, the implementation of this model classifies the features and phenomena under study into a range between clustered and dispersed patterns. A clustered pattern implies that the features are grouped closely together, whereas a dispersed pattern means that the features are distributed without any relationship to each other, as shown in the figure below. (Figure 2)
Figure 2. Clustered and dispersed pattern models
Results
The figure below shows a hotspot analysis map. The results of this analysis and the examination of the population distribution in Yazd indicate that the population density is not uniform across different areas. The population density is higher in areas 2, 3, and 4 than in areas 1 and the historical area. (Figure 3)
The figure below shows a hotspot analysis map. The results of this analysis and the examination of the population distribution in Yazd indicate that the population density is not uniform across different areas. The population density is higher in areas 2, 3, and 4 than in areas 1 and the historical area. (Figure 3)
Figure 3. Population distribution in the areas of Yazd city based on hotspot analysis
According to the existing standard, which requires one laboratory for every 153.86 hectares, it can be observed that the area with the fewest number and the greatest distance to the desired facility is Area 4, where there is one laboratory for every 742.69 hectares. The area with the highest number and shortest distance was the historical area, with one laboratory for every 51.4 hectares. Only Area 2 is relatively close to the standard.
Additionally, according to the standard for pharmacies, which requires one pharmacy for every 5000 people, the area with the least number of pharmacies and, in fact, the greatest distance between facilities is Area 4 (one pharmacy for every 14,636.11 people), and the area with the most pharmacies and shortest distance is the historical area (one pharmacy for every 1,811.57 people).
The figure below shows the location and distribution of the two types of facilities across different areas of Yazd city. (Figure 4)
Figure 4. Density of medical laboratories and pharmacies
As shown in the above figure, the highest concentration of medical laboratories was observed in the historical area. In many regions, such as areas 1 and 3, the density is low, and in several areas, there is even a lack of medical laboratories. Regarding pharmacies, the highest concentration was also in the historical area. Calculations revealed that the average direct distance between each laboratory and the nearest laboratory was 999 m (approximately 1 km), whereas the average direct distance between each pharmacy and the nearest pharmacy was 607 m.
Using the Thiessen model, the functional pressure–volume of these two facilities in different areas of Yazd was examined. Figure 3 presents the results of this analysis, depicting the functional areas of medical laboratories and pharmacies in the city. The highest functional pressure for medical laboratories exists in most parts of the city, except for the historical area and parts of Area 2. Similarly, the highest functional pressure for pharmacies was found in parts of Areas 1, 2 and 4. (Figure 5)
The figure below shows the results obtained from the buffer technique and the analysis of the overlap in the accessibility radius of the studied facilities in Yazd. As can be seen, the highest overlap in the accessibility radius of medical laboratories occurs in Areas 2 and the Historical area. However, in other areas, there was little overlap, and many points in these areas were not within the accessibility radius of any medical laboratory. Regarding pharmacies, the highest overlap of pharmacies in Yazd city was observed in Areas 1, 2 and the Historical area, whereas in Areas 3 and 4, the overlap of these facilities was less noticeable. (Figure 6)
The results obtained from calculating the average nearest-neighbor distance for each of the studied facilities are as follows: (Figure 7)
Figure 5. Functional areas of medical laboratories and pharmacies
Figure 6. Overlap in the accessibility radius of medical laboratories and pharmacies
|
|
As can be seen, the dispersion pattern of this facility is random. In other words, the distribution of medical laboratories in Yazd City is not significantly related to each other.
The dispersion pattern of this facility was clustered. In other words, the pharmacies are located in clusters next to each other.
Based on the figure below (Figure 8), the accessibility scores of the studied facilities were calculated. The results were as follows:
The specified radius for medical laboratories, according to the standard, was 700 m. Based on this, the minimum access score was calculated as 0, whereas the maximum score was 0.049, indicating a slight difference in this regard. For pharmacies, according to the existing standard (one pharmacy for every 7,000 people), a 500-meter walking distance within the neighborhood was considered the accessibility threshold. Calculations based on this standard showed that the minimum access score was 0, while the maximum was 1.47, indicating a slight difference in the calculations for this facility. The figure below illustrates this process.
Figure 8. Accessibility scores for medical laboratories and pharmacies
Based on the map above, it can be concluded that, except for Areas 2 and Historical, the lowest accessibility to medical laboratories is observed in the other areas. Similarly, except for the historical area, the lowest accessibility to pharmacies was found in the other areas.
Discussion
This study examined the spatial distribution and accessibility of medical diagnostic laboratories and pharmacies in Yazd, revealing significant disparities in service provision across different urban areas. The city hosts 57 medical laboratories, and their spatial arrangement follows a random pattern, with the highest concentration and functional pressure located in the historical area. However, hotspot analysis indicated a lower population density in this area, suggesting a misalignment between service availability and population distribution. The accessibility scores for medical laboratories further illustrate that most areas, with the exception of Areas 2 and Historical, experience low levels of access, indicating an inequitable distribution of these essential facilities across the region.
The findings of this study align with those of Sadeghi et al. (2017), who examined the distribution of diagnostic laboratories in Shiraz, Hamadan, and Shushtar. In their study, Shiraz was found to have 64 independent laboratories, with the potential for 241 new laboratories, whereas Hamadan had 24 independent laboratories and the capacity for an additional 143. Shushtar, on the other hand, had only three independent laboratories but the potential for nine new ones (33). Similarly, a study conducted by Sedighi et al. (2016) in Qom found that the city, with a per capita standard of 0.04 m² of laboratory space outside hospitals, would require the establishment of 182 new independent laboratories to meet its diagnostic needs (34). These studies support the findings of the present study, highlighting a consistent shortage of diagnostic laboratories across various cities in relation to the existing population distribution.
In terms of pharmacies, the analysis revealed that the highest concentration of pharmacies in Yazd was found in Areas 2 and Historical. While Area 2, a densely populated region, shows a distribution of pharmacies proportional to its population, the historical area, which has a lower population density, exhibits a disproportionate concentration of pharmacies. The accessibility scores for pharmacies across Yazd demonstrated minimal variation, indicating generally weak and uniform access to these services. This suggests that the distribution of pharmacies in the city does not align with the population density and varying needs of different areas, resulting in inequitable access.
These findings are consistent with those of Ghazanfarpour et al. (2022) in Sirjan, who reported a need for 25 daily pharmacies to ensure optimal citizen access, with an additional nine pharmacies required in proposed locations (35). Jebadari et al. (2016) also found that the majority of pharmacies in Shiraz did not comply with the Ministry of Health's guidelines for such services (37). Collectively, these studies reinforce the conclusion that the distribution of pharmacies in many cities, including Yazd, is not aligned with the population distribution, leading to inequitable access to essential services.
In summary, the results of this study, in conjunction with previous research, underscore the need for a more equitable and population-aligned distribution of medical laboratories and pharmacies in urban areas. Without addressing these disparities, cities risk perpetuating unequal access to vital healthcare services, which can exacerbate social and health inequity. Urban planners and policymakers should consider these findings when designing future healthcare infrastructure, ensuring that services are distributed in a manner that reflects the needs of the population and promotes greater social equity.
Strengths
- Using official and up-to-date data from reputable organizations such as the Food and Drug Administration, Yazd Municipality, and the Statistical Center of Iran.
- Using three simultaneous approaches: Euclidean distance, Thiessen model, and Two-Step Floating Catchment Area (2SFCA) model to assess spatial accessibility.
- Provide a step-by-step framework for work repeatability, using standards.
Limitations
- Assuming simultaneous availability of all centers at all times, regardless of the centers' working hours and current capacity.
- Possible errors in address/zip code location, asynchronous updates between pharmacy and laboratory data and demographic data.
-The interpretation of some local and national standards may differ from baselines for other cities; generalizing the results to other cities requires re-adaptation.
Conclusion
This study examined the spatial accessibility of medical diagnostic laboratories and pharmacies in Yazd using GIS. The results revealed that accessibility to these services differed across the city, with Area 2 demonstrating a distribution that aligned with the population density of the region. Conversely, other areas showed lower accessibility levels that did not correspond with the population, indicating an uneven and inequitable distribution of these services.
Given these findings, urban planners must integrate relevant standards and account for population distribution when planning and establishing essential healthcare services. Laboratories and pharmacies, as critical and often urgent services, require careful consideration of their placement and accessibility. By adopting such an approach, the equitable distribution of these services can be improved, ultimately fostering greater social equity and reducing disparities in access to vital health services in the future.
Ethical considerations
This study was conducted with the necessary permits and code of ethics from the Research Vice-Chancellor of Shahid Sadoughi University of Medical Sciences (IR.SSU.SPH.REC.1400.010).
Acknowledgments
The authors would like to thank Shahid Sadoughi University of Medical Sciences, Yazd, for their financial support of this study, and the Yazd Municipality, the Medical System Organization, and the Deputy Ministers of Health, Treatment, and Food and Drug Administration for their participation in the project.
Conflict of interests
The authors declared no conflicts of interest.
Authors’ contributions
E.S was involved with study design, data collection, analysis of results, writing the draft of the article, and final approval of the article. M.A did the analysis of results and final approval of the article. H.A engaged in final approval for the article; and M.R. carried out study design, analysis of results, article writing, and final approval of the article.
References
1. Bauer J, Groneberg DA. Measuring spatial accessibility of health care providers–introduction of a variable distance decay function within the floating catchment area (FCA) method. PloS one. 2016;11(7): e0159148.
2. Fransen K, Haslam SA, Steffens NK, Vanbeselaere N, De Cuyper B, Boen F. Believing in “us”: Exploring leaders’ capacity to enhance team confidence and performance by building a sense of shared social identity. Journal of Experimental Psychology: Applied. 2015;21(1):89-100.
3. Goddard M, Smith P. Equity of access to health care services: Theory and evidence from the UK. Social Science & Medicine. 2001;53(9):1149-62.
4. Mayaud JR, Tran M, Pereira RH, Nuttall R. Future access to essential services in a growing smart city: The case of Surrey, British Columbia. Computers, Environment and Urban Systems. 2019;73:1-15.
5. Luo W. Using a GIS-based floating catchment method to assess areas with shortage of physicians. Health & Place. 2004;10(1):1-11.
6.Organization WH. Sustainable development goals (SDGs): Goal 3. Target 3.8: Achieve universal health coverage, including financial risk protection, access to quality essential health-care services and access to safe, effective, quality and affordable essential medicines and vaccines for all; 2016. [poster].
7. Wirtz VJ, Hogerzeil HV, Gray AL, Bigdeli M, de Joncheere CP, Ewen MA, et al. Essential Medicines for Universal Health Coverage. The Lancet. 2017; 389(10067):403-76.
8. Joint F. WHO guidelines on good pharmacy practice: standards for quality of pharmacy services. WHO Technical Report Series. 2011;961(1):310-23.
9. Askari R, Shafiee M, Charrahi Z, Almodarresi SA, Afrazandeh SM. Investigating the level of access to hospital medical facilities using the geographical information system (GIS) in Yazd, Iran, in 2019. Journal of Community Health Research. 2020;9(4):241-55.
10. Reshadat S, Saeidi S, Zangeneh A. Using a geographic information system to identify the number and location of new health centres needed in the city of Kermanshah, Islamic Republic of Iran. Eastern Mediterranean Health Journal. 2020;26(8): 888-98.
11. Almansi KY, Shariff ARM, Kalantar B, Abdullah AF, Ismail SNS, Ueda N. Performance evaluation of hospital site suitability using multilayer perceptron (MLP) and analytical hierarchy process (AHP) models in Malacca, Malaysia. Sustainability. 2022;14(7):3731.
12. Dutta B, Das M, Roy U, Das S, Rath S. Spatial analysis and modelling for primary healthcare site selection in midnapore town, west bengal. GeoJournal. 2022;87(6): 4807-36.
13. Law MR, Heard D, Fisher J, Douillard J, Muzika G, Sketris IS. The geographic accessibility of pharmacies in Nova Scotia. Canadian Pharmacists Journal/Revue des Pharmaciens du Canada. 2013;146(1):39-46.
14. Montenegro H, Holder R, Ramagem C, Urrutia S, Fabrega R, Tasca R, et al. Combating health care fragmentation through integrated health service delivery networks in the Americas: lessons learned. Journal of Integrated Care. 2011;19(5):5-16.
15. Yip W, Hsiao W. Harnessing the privatisation of China's fragmented health-care delivery. The Lancet. 2014;384(9945):805-18.
16. Asadi F, Moghaddasi H, Mastaneh Z. Situation analysis of hematology information systems in educational-therapeutic hospital laboratories of Shaheed Beheshti University of Medical Sciences. Health Information Management. 2009;6(1):11-21.
17. Carey G, Crammond B, Malbon E. Personalisation schemes in social care and inequality: review of the evidence and early theorising. International Journal for Equity in Health. 2019;18(1):1-10.
18. Almasi A, Saeidi S, Zangeneh A, Khezeli M, Salimi Y, Soofi M, Gilan NR. Geographical access of the elderly to health care centers during a 20-year period (1996–2016): a case study of Kermanshah, Iran. Journal of General Internal Medicine. 2020;36(10):3249-51.
19. Lao MSR, Paringit MCR, Roleda SRL. GIS-based site suitability analysis for healthcare facility development in Tacloban City, Philippines. GEOMATE Journal. 2022;22(92):16-23.
20.Parvin F, Ali SA, Hashmi SNI, Khatoon A. Accessibility and site suitability for healthcare services using GIS-based hybrid decision-making approach: a study in Murshidabad, India. Spatial Information Research. 2021;29(1):1-18.
21. Lankila T, Näyhä S, Rautio A, Rusanen J, Taanila A, Koiranen M. Is geographical distance a barrier in the use of public primary health services among rural and urban young adults? Experience from Northern Finland. Public Health. 2016;131:82-91.
22. Baskin L, Abdullah A, Guo M, Naugler C. Use of geospatial mapping to determine suitable locations for patient service centers for phlebotomy services. American Journal of Clinical Pathology. 2015;144(5): 727-30.
23. Yazd Municipality ICT Organization. Map of the zoning of the five districts of Yazd Municipality [Internet]. Yazd: Yazd Municipality ICT Organization; [cited 2026 May 23]. Available from: https://fava.yazd.ir/fa
24. Rahnama MR, Amirkhariyan M. Analysis of spatial accessibility to health services in Mashhad City. J Urban Develop Plan. 2013;1(3):61-74. Doi: 10.22108/judp.2013.15183
25. Sharifzadegan1 M, Mamdohi M, Lavi M. (2010). A P- median-model-based Analysis of Spatial Inequality in Accessibility to Public Health Care Intended for Urban Health Development in Isfahan City. Refahj. 10(37), 265-285.
26. Sadighi J, Hosseini A, Mohammad K, Mahdav S, Mirab Samiee S, Safade N, et al. Geographical accessibility to medical laboratory services in Iran: Takab case study. Payesh. 2015;14(6):647-665.
27. Ghazanfarpour H, Moslemizade A. Locating pharmacies and its optimal spatial distribution in sirjan city in line with the desired access of citizens. 2022;12(45):79-106.
28. Sadighi J, Hosseini A, Mohammad K, Mahdavi S, Samieearnaq SM, Safadel N, et al. Geographical access to medical diagnostic laboratory centers in Iran: Designing an access model (location and number of laboratories). Payesh (Health Monitor). 2015;14(5):537-53.
29. Ziari K. Urban land use planning. Tehran: University of Tehran Press. 2010
30. Detailed plan for definitions and concepts of urban land use and determine their per capita, Urban Planning and Architecture High Council, Approved on 2010. [Persian]
31. Amirfakhrian M. Investigating the feasibility of educational applications in a detailed plan using GIS (study area of Mashhad city). [Research Project]. Ferdowsi University of Mashhad; Khorasan Razavi Province Schools Renovation, Development and Equipping Organization; Autumn 2019.
32. Aghajani Mamareh, M. Accessibility planning for sustainable development (phase ii) (12-1431). 2012.
33.Sadighi, et al. Geographical access to medical diagnostic laboratories in the cities of shiraz, hamadan and shushtar: A geographic information system-based study. Payesh. 2017.
34. Sedighi Z, Hosseini A, Mohammad K, Mahdavi S., Samiei SM, Safadel NA, et al. Geographical access to medical diagnostic laboratory centers in the country: A case study of qom city. Payesh. 2016; 15(3):259-79.
35. Gazanfarpour H, Mehrabi Nejad A, Moslemi Zadeh A. Pharmacy location and optimal spatial distribution in sirjan city for optimal citizen access. Geography and Regional Urban Planning. 2022;12(45):79-106.
36. Jabbedari M M, Karami J, Sarkargar Ardekani A. The location analysis of the local pharmacies by the multi criteria decision-making AHP-Fuzzy method (case study IRAN-SHIRAZ). J Adv Biomed Sci. 2016;6(1):19-26.
Type of Study: Original article |
Subject:
Healt care Management
Received: 2025/12/23 | Accepted: 2026/05/27 | Published: 2026/06/1
Received: 2025/12/23 | Accepted: 2026/05/27 | Published: 2026/06/1
Send email to the article author
| Rights and permissions | |
 |
This work is licensed under a Creative Commons Attribution-NonCommercial 4.0 International License. |
