

Volume 1, Issue 3 (9-2017)
EBHPME 2017, 1(3): 151-157 |
Back to browse issues page

Download citation:
BibTeX | RIS | EndNote | Medlars | ProCite | Reference Manager | RefWorks
Send citation to:


BibTeX | RIS | EndNote | Medlars | ProCite | Reference Manager | RefWorks
Send citation to:
Qodoosinejad J, Daemi A, Saadati M, Yaghoubi R. Evaluation of the Efficiency of Tabriz Hospitals; Using the Pabon Lasso Model in a 5-Year Period. EBHPME 2017; 1 (3) :151-157
URL: http://jebhpme.ssu.ac.ir/article-1-87-en.html
URL: http://jebhpme.ssu.ac.ir/article-1-87-en.html


School of Health Services Management, Baqiyatallah University of Medical Sciences, Tehran, Iran
Full-Text [PDF 477 kb]
(1254 Downloads)
| Abstract (HTML) (4512 Views)
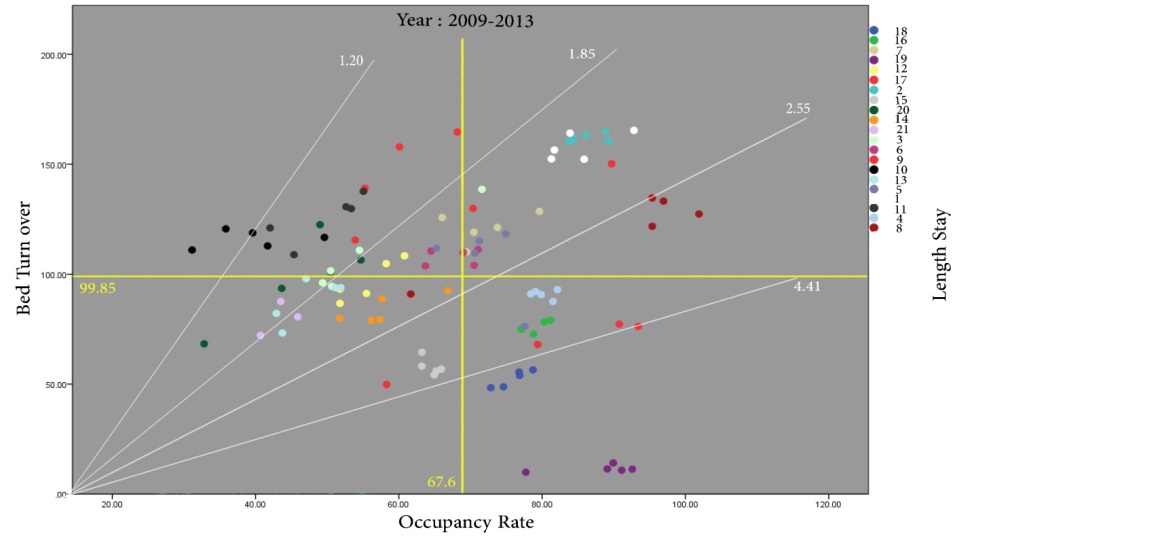

Figure 1. Overview of the hospitals in Tabriz during 2009-2013
Discussion
The aim of this study was to evaluate the efficiency of hospitals in Tabriz during 5 years. Based on the results, an average of 67.6% bed occupancy, and 104.3 times of annual bed turnover, and 2.48 days of average length of stay (excluding hospitals of psychiatric specialty) and comparison of these indices with the standards of the Ministry of Health and Medical Education, hospitals in Tabriz are in a desirable level in terms of bed turnover index and average length of stay and also a moderate rate of bed occupancy. Also, based on the comparison of efficiency indices from 2009 to 2013, it was found that the index of bed occupancy rate increased by 3% during 5 years, the bed turnover index increased by 8 times and the average length of stay decreased by 0.17 day. These figures indicate the growth of efficiency indices studied over the
past 5 years. Therefore, hospitals should take measures such as patient reception and create new specializations for admitting patients to improve their bed occupancy rate.
The comparison of indices with the study of Miraki et al. (21), 2007- 2011 and Rezaei et al. (22) 2006-2011 1revealed that the average of the indices studied in Tabriz hospitals was higher than the hospitals of Kurdistan University of Medical Sciences (bed occupancy rate = 62.5, average stay = 3.4, bed turnover = 79) and Kermanshah University of Medical Sciences (bed occupancy rate 64.4, average stay = 3.7, bed turnover = 81.8). However, the results of Miraki et al. (21), revealed that the health centers from 2007, which included 25% of the health centers (3 regions) in the first region, 25% of the health centers (3 centers) in the second region, 33% of the health centers (4 centers) in the third region, and 17% of health centers (2 centers) were in the fourth region which reached 8% (1 center), 41% (5 centers), 33% (4 centers) and 17% (2 centers) in 2011, which had a more satisfactory progress than the present study (22). Although the efficiency status of Pabon Lasso in Tabriz hospitals is in poor condition compared to other provinces such as Isfahan, Shiraz and Kerman, hospitals in Tabriz showed better efficiency than the above hospitals when comparing the bed indices (20, 22). One of the reasons for this difference is the fact that the bed turnover in the Tabriz hospitals is higher because the horizontal axis of the Pabon Lasso chart is higher than the rest of the country and, accordingly, more hospitals fall in Regions 1 and 4.
In this study, during five years, the number of hospitals in Region 1 of the Pabon Lasso model increased. These hospitals should increase the bed turnover and occupancy rate of the hospital bed with measures such as preventing the expansion of the center and, if possible, transferring a number of existing beds to the treatment center and using them in other medical centers covered by the university (15).
Due to the nature of ophthalmology and obstetrics hospitals (low bed occupancy rate and high bed turnover), Region 2 represents the undesirable condition of some hospitals with non-ophthalmology and maternity specialties. During the 5 year period of this study, the number of hospitals in the region decreased. The remaining hospitals in the region can take steps to improve their living standards, reduce the number of beds and reduce the number of unnecessary hospital beds. The status of the hospitals in Region 3 is desirable and there should be planning for the performance stability and the improvement of the hospitals using the lowest number of beds (21). The nature of mental and elderly hospitals is such that they have low bed turnover and high bed occupancy rates due to the treatment of chronic diseases. An important strategy to improve the efficiency of these centers is to emphasize cost reduction, quality improvement and outpatient services (15, 23). Hospitals located in low-efficiency regions are mainly affected by the presence of excess beds or poor distribution of beds between the departments, low quality of provision of services and low affordability in low income groups, the absence of a covered region and in the proximity of hospitals, failure to comply with the requirements for service leveling by providers all are controversial (22).
Conclusion
The further growth of Region 1 compared to Region 3 in 5 years indicates the negative growth in the efficiency and improvement of Tabriz hospitals. Although the three indices have increased during this period, which is necessary for the survival of hospitals in the present age, lack of improvement in the efficiency and allocation of resources in the present time, will affect the improvement and advancement of the quality of health services in the future including financial, qualitative, human and technology challenges. It is suggested that unnecessary hospitalization be reduced by facilitating home care. In addition, paying more attention to the health sector, and increasing the capacity of hospital beds should be on the agenda. Actions such as recognizing the capabilities and facilities in the health and medical networks, adequate funding and required human resources,
applying the principles of scientific management in health centers, leveling the provision of services at different levels of the health care network system will also be helpful.
Conflicts of interest
No conflict of interests exists.
Acknowledgments
Hereby, authors would like to state their acknowledgements to all those who participated in this study.
Authors' contributions
Qodoosinejad J, Yaghoubi R designed research; Qodoosinejad J, Saadati M, Daemi M conducted research; Yaghoubi R analyzed data; Yaghoubi R, Saadati M, Daemi A wrote the paper; Yaghoubi R had primary responsibility for final content. All authors read and approved the final manuscript.
References
Full-Text: (1289 Views)
Pabon Lasso Model in a 5-Year PeriodEvaluation of the Efficiency of Tabriz Hospitals; Using the
Javad Qodoosinejad 1, Amin Daemi 2, Mohammad Saadati 3, Rouhollah Yaghoubi 4*
1 Social Determinants of Health Research Center, Birjand University of Medical Sciences, Birjand, Iran
2 Department of Health Services Management, School of Health Management and Information Sciences, Iran University of Medical Sciences, Tehran, Iran
3 Department of Health Services Management, School of Health Management and Information Sciences, Iran University of Medical Sciences, Tehran, Iran
4 School of Health Services Management, Baqiyatallah University of Medical Sciences, Tehran, Iran
Introduction
Javad Qodoosinejad 1, Amin Daemi 2, Mohammad Saadati 3, Rouhollah Yaghoubi 4*
1 Social Determinants of Health Research Center, Birjand University of Medical Sciences, Birjand, Iran
2 Department of Health Services Management, School of Health Management and Information Sciences, Iran University of Medical Sciences, Tehran, Iran
3 Department of Health Services Management, School of Health Management and Information Sciences, Iran University of Medical Sciences, Tehran, Iran
4 School of Health Services Management, Baqiyatallah University of Medical Sciences, Tehran, Iran
| A R T I C L E I N F O | A B S T R A C T | |
| Article History: Received: 3 July 2017 Revised: 8 Aug 2017 Accepted: 5 Sep 2017 |
Background: Hospitals are the largest and most costly operating units of health systems, and their share of current government expenditures in the healthcare sector is between 50 and 80 percent. The hospital efficiency is more indicative of the proper function of the resources devoted to it. The aim of this study was to evaluate the efficiency of hospitals in Tabriz by using the Pabon Lasso model. Methods: This is a descriptive study that investigated the efficiency of Tabriz hospitals during 2009-2013. All hospitals of Tabriz were entered by census. Data (bed occupancy rate, bed turnover and patient length of stay) were collected in summer 2014 and charts were plotted using SPSS 19 software. Results: The mean of Pabon Lasso's three indices of efficiency in 5 years (excluding psychiatric beds) was 67.6% for bed occupancy rate, 104.3 times bed turnover, and 2.48 days average patient length of stay. The coefficient of bed occupancy increased by 3% over 5 years, the bed turnover index increased by 8 times and the average length of stay decreased by 0.17 day. On average, 25.2% of hospitals were in Region 1, 23.5% in Region 2, 26.1% in Region 3 and 25.2% in Region 4 of Pabon Lasso Diagram. Conclusion: The presence of 26% of hospitals in the region of Pabon Lasso Diagram shows the effective efficiency of hospitals which is not an acceptable statistics for hospitals and requires the intervention of health practitioners and policymakers. Keywords: Pabon Lasso, Efficiency, Hospital |
|
| *Corresponding Author: Rouhollah Yaghoubi School of Health Services Management, Baqiyatallah University of Medical Sciences, Mollasadra st., Baqiyatallah University, Tehran, Iran. Email: yaghoobi.ru@gmail.com Tel: +98-9149975349 |
||
Citation : This paper should be cited as: Qodoosinejad J, Daemi A, Saadati M, Yaghoubi R. Evaluation of the Efficiency of Tabriz Hospitals; Using the Pabon Lasso Model in a 5-Year Period. Evidence Based Health Policy, Management & Economics. 2017; 1(3): 151-7.
Introduction
Over the last decade, the health sector in most countries has faced a significant increase in health care costs and in particular, rise in hospital costs (1). Hospitals, as one of the most important community health centers, are also the largest and most costly operational units of these centers. It accounts for 50 to 80% of government expenditure in the health sector, and in other statistics, based on WHO report, in third world countries, half of the national cost is spent on these centers (2-5).
Moreover, by spending these huge resources in these institutions, their efficiency must be carefully measured. One of the ways to accurately measure efficiency is to adapt to standards (6). Hospital efficiency standards can be evaluated in different aspects, such as quality, efficiency, productivity and accessibility (7). One of the models that is currently used considering the necessity of observing the principle of productivity in the optimal use of resources is efficiency evaluation using hospital efficiency indices (8). Efficiency in brief means maximizing the use of resources to generate returns. In order to determine the efficiency or inefficiency of each firm, appropriate indicator or indices should be used as a criterion (9). The most important and most effective indices of efficiency measurement are bed occupancy rate, bed turnover, and the average length of stay (10, 11). The criteria defined for the above indices by the Ministry of Health and Medical Education of Iran fall into three levels: desirable, moderate and undesirable (12). Based on the I.R.Iran budget organization of 2002, approximately 300 billion Rials are wasted annually for unused hospital beds, which according to the calculations of the Central Bank of the Islamic Republic of Iran, has 9 times the value in the year 2016 (base on inflation). This is why many patients cannot be admitted due to lack of access to a hospital rbed or for other
reasons (6, 13).
One of the useful ways to evaluate the efficiency of the three above-mentioned indices is to use the Pabon Lasso model. This model was introduced in 1986 by Pabon Lasso and was used to evaluate the efficiency of hospitals (14). The benefits of using the Pabon Lasso model include the rapid identification of poorly functioning health centers, the identification of regions requiring improvement, and the identification of useful strategies to improve the efficiency of health centers (15). In this model, hospitals are located in four regions; each region represents the type of efficiency and resource efficiency according to the type of hospital expertise.
Based on the Pabon Lasso model, the status of the health centers in each of the four regions and the interpretation of each region is as follows:
Region 1 (Southwest side of the chart): Low bed occupancy rate and low bed turnover rate, this feature is specific to centers where bed supply is more than demand for health care.
Region 2 (northwestern side of the chart): Low bed occupancy rate and high bed turnover rate indicate the unnecessary hospitalization of patients and the extra bed capacity in health centers (characteristics of Obstetrics and Gynecology departments).
Region 3 (Northeastern side of the chart): High bed occupancy rate and high bed rate, these centers have a good efficiency despite the use of the minimum number of beds. Region 4 (Southeast side of the chart): High bed occupancy rate and low bed turnover rates indicate long-term hospitalization, low utilization of outpatient facilities and high costs (characteristics of psychiatric and elderly care centers).
Due to lack of a similar study in Tabriz and the importance of these indices in improving the behavior of managers in the allocation and utilization of resources as well as country studies, generally carried out using one-year data (14, 16-20), this study was conducted to investigate the efficiency of hospitals in Tabriz during the 5-year period from 2009-2013.
Materials and Methods
This is a descriptive and retrospective study conducted in 2014. Sampling was done in a census that included all 21 hospitals in Tabriz (11 university hospitals and 10 non-university hospitals). The study data covers the five year period from 2009 to 2013. The Pabon Lasso model was used to evaluate the efficiency of health centers in this study. In this model, the horizontal axis chart shows the percentage of bed occupancy and the vertical axis represents the bed turnover rate and the parallel axis with these two (vertical and horizontal axes) represents the length of stay. Therefore, a point on parallel axes by a line drawn from the origin of the coordinates and the point obtained from the two available indices indicate the average length of stay, and this value is increased uniformly from left to right and up to down (21).
The aim of this study was to measure the efficacy of hospitals affiliated with Tabriz University of Medical Sciences using the Pabon Lasso chart. Indices required to evaluate the efficiency of health centers were obtained by a questionnaire based on the indices of the Ministry of Health and through the treatment Deputy of Tabriz University of Medical Sciences (12). SPSS19 software was used for data analysis and illustrate the Pabon Lasso chart.
In addition, the declaration of Helsinki was considered for ethical issues.
Results
Among the 21 hospitals studied, the efficiency indices including the average percentage of bed occupancy, the average bed turnover, and the average length of stay within 5 years (including psychiatric hospitals and without it) are presented in Table 1.
According to the results, during the 5 years of investigation, the distribution of hospitals studied in the 4 regions of Pabon Lasso is described in Table 2 and Figure 1.
Figure 1. Overview of the hospitals in Tabriz during 2009-2013
The status of hospitals in Tabriz from 2009 to 2013 indicated the presence of an average 25.2% of hospitals in Region 1, 23.5% in Region 2, 26.1% in Region 3, and 25.2% in Region 4.
Changes in the regions during the 5-year period increased for regions one (25 to 33.3%) and three (25 to 28.5%), and decreased for regions two (20 to 14.2%) and four (30 to 23.8%).
The status of the hospitals according to specialty is as follows:
The highest and lowest occupancy rates were found in single psychiatric hospitals (88.09, one hospital) and ophthalmology hospitals (47.60, two hospitals). Also, the highest and lowest bed turnover were assigned to single-specialized hospitals with Obstetrics and Gynecology specialties (128.40, 5 hospitals) and psychiatry (11.53, one hospital), respectively. The highest and lowest average stay are related to single-specialized hospitals with psychiatric specialties (27.76, one hospital) and ophthalmology (1.65, two hospitals).
The growth of the number of existing hospitals during 2009-2013 in Regions 1, 2, 3, and 4 equals -5, +5, -5, +5%, respectively (excluding the hospital with incomplete information). These results reveal the negative growth of Regions 2 and 4, as well as the positive growth of Regions 1 and 3. The percentage of hospital distribution in the four regions of Pabon Lasso was equal. In the 5-year period (2009-2013), Pabon Lasso's one and three diagrams were evaluated as undesirable and desirable in terms of efficiency. On average, we witnessed the presence of 25% (five) hospitals in these two regions (Table 2).
Table 1. Comparison of the three indices of hospital efficiency with desirable situation from
the perspective of the Ministry of Health
Table 2. Distribution of studied hospitals in Pabon Lasso Quadruples from 2009 to 2013 * Information of one of the hospitals (with psychiatric specialty) due to lack of data has been registered only from 2011 to 2013.
the perspective of the Ministry of Health
Table 2. Distribution of studied hospitals in Pabon Lasso Quadruples from 2009 to 2013 * Information of one of the hospitals (with psychiatric specialty) due to lack of data has been registered only from 2011 to 2013.
Discussion
The aim of this study was to evaluate the efficiency of hospitals in Tabriz during 5 years. Based on the results, an average of 67.6% bed occupancy, and 104.3 times of annual bed turnover, and 2.48 days of average length of stay (excluding hospitals of psychiatric specialty) and comparison of these indices with the standards of the Ministry of Health and Medical Education, hospitals in Tabriz are in a desirable level in terms of bed turnover index and average length of stay and also a moderate rate of bed occupancy. Also, based on the comparison of efficiency indices from 2009 to 2013, it was found that the index of bed occupancy rate increased by 3% during 5 years, the bed turnover index increased by 8 times and the average length of stay decreased by 0.17 day. These figures indicate the growth of efficiency indices studied over the
past 5 years. Therefore, hospitals should take measures such as patient reception and create new specializations for admitting patients to improve their bed occupancy rate.
The comparison of indices with the study of Miraki et al. (21), 2007- 2011 and Rezaei et al. (22) 2006-2011 1revealed that the average of the indices studied in Tabriz hospitals was higher than the hospitals of Kurdistan University of Medical Sciences (bed occupancy rate = 62.5, average stay = 3.4, bed turnover = 79) and Kermanshah University of Medical Sciences (bed occupancy rate 64.4, average stay = 3.7, bed turnover = 81.8). However, the results of Miraki et al. (21), revealed that the health centers from 2007, which included 25% of the health centers (3 regions) in the first region, 25% of the health centers (3 centers) in the second region, 33% of the health centers (4 centers) in the third region, and 17% of health centers (2 centers) were in the fourth region which reached 8% (1 center), 41% (5 centers), 33% (4 centers) and 17% (2 centers) in 2011, which had a more satisfactory progress than the present study (22). Although the efficiency status of Pabon Lasso in Tabriz hospitals is in poor condition compared to other provinces such as Isfahan, Shiraz and Kerman, hospitals in Tabriz showed better efficiency than the above hospitals when comparing the bed indices (20, 22). One of the reasons for this difference is the fact that the bed turnover in the Tabriz hospitals is higher because the horizontal axis of the Pabon Lasso chart is higher than the rest of the country and, accordingly, more hospitals fall in Regions 1 and 4.
In this study, during five years, the number of hospitals in Region 1 of the Pabon Lasso model increased. These hospitals should increase the bed turnover and occupancy rate of the hospital bed with measures such as preventing the expansion of the center and, if possible, transferring a number of existing beds to the treatment center and using them in other medical centers covered by the university (15).
Due to the nature of ophthalmology and obstetrics hospitals (low bed occupancy rate and high bed turnover), Region 2 represents the undesirable condition of some hospitals with non-ophthalmology and maternity specialties. During the 5 year period of this study, the number of hospitals in the region decreased. The remaining hospitals in the region can take steps to improve their living standards, reduce the number of beds and reduce the number of unnecessary hospital beds. The status of the hospitals in Region 3 is desirable and there should be planning for the performance stability and the improvement of the hospitals using the lowest number of beds (21). The nature of mental and elderly hospitals is such that they have low bed turnover and high bed occupancy rates due to the treatment of chronic diseases. An important strategy to improve the efficiency of these centers is to emphasize cost reduction, quality improvement and outpatient services (15, 23). Hospitals located in low-efficiency regions are mainly affected by the presence of excess beds or poor distribution of beds between the departments, low quality of provision of services and low affordability in low income groups, the absence of a covered region and in the proximity of hospitals, failure to comply with the requirements for service leveling by providers all are controversial (22).
Conclusion
The further growth of Region 1 compared to Region 3 in 5 years indicates the negative growth in the efficiency and improvement of Tabriz hospitals. Although the three indices have increased during this period, which is necessary for the survival of hospitals in the present age, lack of improvement in the efficiency and allocation of resources in the present time, will affect the improvement and advancement of the quality of health services in the future including financial, qualitative, human and technology challenges. It is suggested that unnecessary hospitalization be reduced by facilitating home care. In addition, paying more attention to the health sector, and increasing the capacity of hospital beds should be on the agenda. Actions such as recognizing the capabilities and facilities in the health and medical networks, adequate funding and required human resources,
applying the principles of scientific management in health centers, leveling the provision of services at different levels of the health care network system will also be helpful.
Conflicts of interest
No conflict of interests exists.
Acknowledgments
Hereby, authors would like to state their acknowledgements to all those who participated in this study.
Authors' contributions
Qodoosinejad J, Yaghoubi R designed research; Qodoosinejad J, Saadati M, Daemi M conducted research; Yaghoubi R analyzed data; Yaghoubi R, Saadati M, Daemi A wrote the paper; Yaghoubi R had primary responsibility for final content. All authors read and approved the final manuscript.
References
1) Kavosi Z, Goodarzi S, Almasiankia A. Performance evaluation in hospitals of Lorestan University of Medical Sciences using Pabon-Lasso Model. Journal of Payavard salamat. 2013; 6(5): 365-75. [In Persian]
2) Bastani P, Vatankhah S, Salehi M. Performance Ratio Analysis: A National Study on Iranian Hospitals Affiliated to Ministry of Health and Medical Education. Iranian Journal of Public Health. 2013; 42(8): 876-82.
3) McKee M, Healy J. The role of the hospital in a changing environment. Bull World Health Organ. 2000; 78 (6): 803-10.
4) Ravangard R, Hatam N, Teimourizad A, Jafari A. Factors affecting the technical efficiency of health systems: A case study of Economic Cooperation Organization (ECO) countries (2004–10). Int J Health Policy Manag. 2014; 3(2): 63-9.
4) Shepard D, Dominic H, Yvonne A. Analysis of hospital costs: a manual for managers. Geneva: World Health Organization; 2000. p.vii.
5) ReisiM Nafchy M, Drees F, Mirzaeian R R. Assessment of performance indicators in Hospitals University of Medical Sciences based on the standards of the Ministry of Health. Journal of Shahrekord Uuniversity of Medical Sciences. 2014; 15(6): 60-7. [In Persian]
6) Accorsi S, Corrado B, Fabiani M, Iriso R, Nattabi B, Ayella EO, et al. Competing demands and limited resources in the context of war, poverty and disease: the case of Lacor Hospital. Health policy and development. 2003; 1(1): 29-39.
7) Barnum H, Kutzim J. Public hospitals in developing countries : resource use, cost, financing. 1993 ed. Baltimore: Johns Hopkins University Press; 1993. p. 335.
8) Farrell MJ. The Measurement of Productive Efficiency. Journal of the Royal Statistical Society Series A (General). 1957; 120(3): 253-90.
9) Asefzade S. Hospital's Management and Research. Ghazvin: Hadiseemrouz Publications; 2007.p. 251-4. [in Persian]
10) Sadaghiyani E. Evaluation of Healthcare and Hospital's Standards. tehran: Moein Publications; 1997.p. 62-5. [In Persian]
11) Jonaidi Jafari N, Sadeghi M, Izadi M, Ranjbar R. Comparison of performance indicators in one of hospitals of Tehran with national standards. Journal of Military Medicine. 2011; 12 (4): 223-8.
12) Central Bank of the Islamic Republic of Iran; [cited 2017/7/12. Available from URL: http:// www.cbi.ir/InflationCalculator/ Inflation Calculator _ fa.aspx.
Zahiri M, Keliddar I. Performance evaluating in hospitals affiliated in Ahwaz University of Medical Sciences based on PABON LASSO model. Hospital. 2012; 11(3): 37-44. [In Persian]
Zahiri M, Keliddar I. Performance evaluating in hospitals affiliated in Ahwaz University of Medical Sciences based on PABON LASSO model. Hospital. 2012; 11(3): 37-44. [In Persian]
13) Pabon Lasso H. Evaluating hospital performance through simultaneous application of several indicators. Bulletin of the Pan American Health Organization. 1986; 20(4): 341-57.
14) Amery H, Jafari A, Vafaei nasab M, Nikokaran J. The Simultaneous Assessment of Efficiency Indicators in University-affiliated and University-Nonaffiliated Hospitals via Pabon Lasso Model Application. Tolooebehdasht. 2014; 13(4): 94-103. [In Persian]
15) Bahadori M, Sadeghifar J, Hamouzadeh P, Hakimzadeh SM, Nejati M. Combining multiple indicators to assess hospital performance in Iran using the Pabon Lasso Model. Australasian Medical Journal. 2011; 4(4): 175-9.
16) Davoud A, Issac B, Sadeghi G, Mohammad P, Hossein A, Salarkhah E. Contemporary use of hospital efficiency indicators to evaluate hospital performance using the Pabon Lasso model. European J Buss & Soci Sci. 2014; 3(2): 1-8.
17) Goshtasebi A, Vahdaninia M, Gorgipour R, Samanpour A, Maftoon F, Farzadi F, et al. Assessing Hospital Performance by the Pabon Lasso Model. Iranian Journal of Public Health. 2009; 38(2): 119-24.
18) Nekoei-Moghadam M, Rooholamini A, Yazdi Feizabadi V, Hooshyar P. Comparing Performance of Selected Teaching Hospitals in Kerman and Shiraz Universities of Medical Sciences, Iran, Using Pabon-Lasso Chart. 2. 2012; 1(1): 11-21. [In Persian]
19) Miraki T, Reazei S, Jahanmehr N, Mohamadi M, gharibi F. Assessment of performance of the hospitals of Kurdistan University of Medical Sciences by use of Pabon Lasso Model (2007-2011). SJKU. 2014; 19(1): 114-23. [In Persian]
20) Matin BK, Rezaei S, Soofi M, Karyani AK. Assessing the performance of hospitals at Kermanshah University of Medical Sciences by Pabon Lasso Model (2006-2011). Journal of Kermanshah University of Medical Sciences. 2014; 18(1): 53-61. [In Persian]
21) Mehrolhasani M, Yazdi Feyzabadi V, Barfeh Shahrbabak T. Assessing Performance of Kerman Province`s Hospitals Using Pabon Lasso Diagram between 2008 and 2010. Hospital. 2014; 12(4): 99-108. [In Persian]
Type of Study: Original article |
Subject:
Healt care Management
Received: 2017/07/3 | Accepted: 2017/11/5 | Published: 2018/03/17
Received: 2017/07/3 | Accepted: 2017/11/5 | Published: 2018/03/17
| Rights and permissions | |
 |
This work is licensed under a Creative Commons Attribution-NonCommercial 4.0 International License. |
